We are now observing the one-month anniversary of the first U.S. rate cut, which occurred at the September 18 FOMC meeting. Back then, rate traders were pricing in a jumbo 50bps trim, and that is exactly what they got. Today, to celebrate the occasion, markets are pricing in a 25bps cut with 100% certainty in the next meeting. The point of this note is to put a number on what is being priced in by rates today as a quick numerical reference for future notes.
I apologize if this is starting to look like a macro blog – it is not; my study of the subject is the first part of identifying the equities I am interested in. A great company can be a terrible investment in the wrong environment.
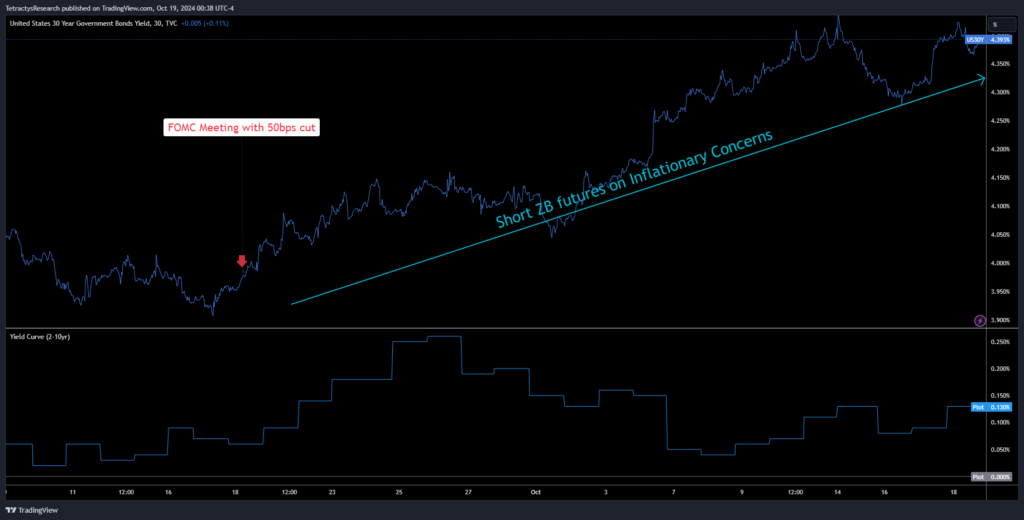
A month ago, this repricing of rates provided an attractive entry point to short 30-year bonds to hedge inflation volatility.
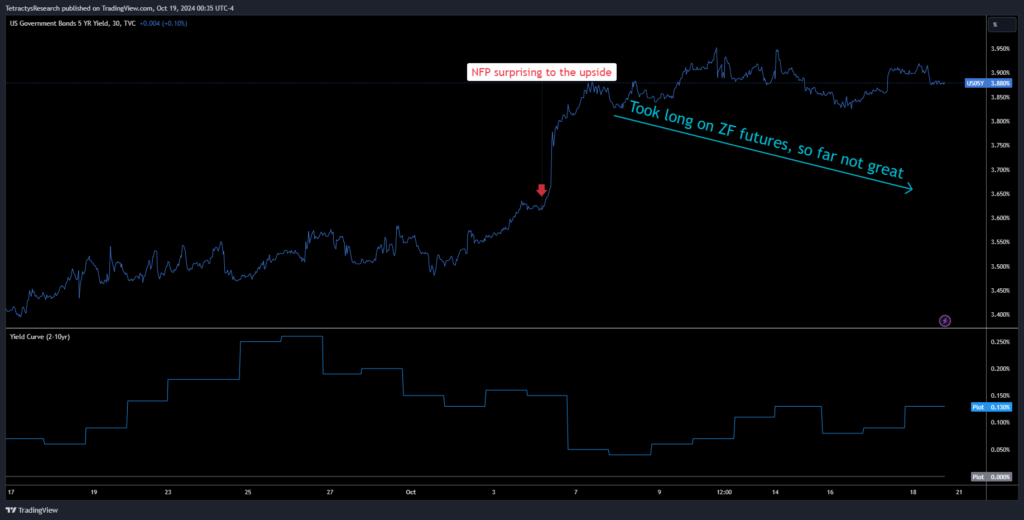
While we put on an initial long on the 5-year to hedge against negative economic data subsequent to the repricing from the surprisingly positive NFP. This trade is thus far out of the money (hence I like to remind my self it is a hedge)
The rationale for taking on these trades has been laid out in the following notes:
Fed and China go big or go home
Due to this, I am long the short end (below 5y with ZT & ZF) to benefit from the continued steepening of the curve and short the long end (above 10y with ZN & ZB) to hedge against inflation picking up.
Quick rates update post NFP
I am now interested in setting up an initial position (75bps of nav) on ZT’s (2y, 50%) and ZF’s (5y, 50%) now that our entering condition of closer to 25bps successive cuts in the STIR markets is much closer to being priced in. This position can serve as both a recession hedge from pricing in another significant cut, causing short rates to rally if negative data on growth comes in, and benefit from the cyclical goldilocks regime we currently are in of short-term stable inflation and continued growth.
The macro setup for equities
Saying that structural risks are shifting away from economic growth to inflation does not preclude economic contractions, but it does imply that a fiscal spending put (à la Fed put) is to be expected, which will attempt to limit the scope and frequency of economic contractions.
One month later, what is the state of the U.S. rates complex?
The STIR markets achieved on the 18th of October a remarkable level of certainty pricing in a 100% probability of a 25bps cut for the November meeting. This is in contrast to the 60% probability priced in wrapping up the FOMC.
Looking ahead to one year, how has the STIR market implied probability of the terminal rate evolved? The overall rate distribution has shifted up 50bps from a mode at 300bps top of the band (-2% from today’s 500bps) to 350bps top of the band (-1.5% from today)
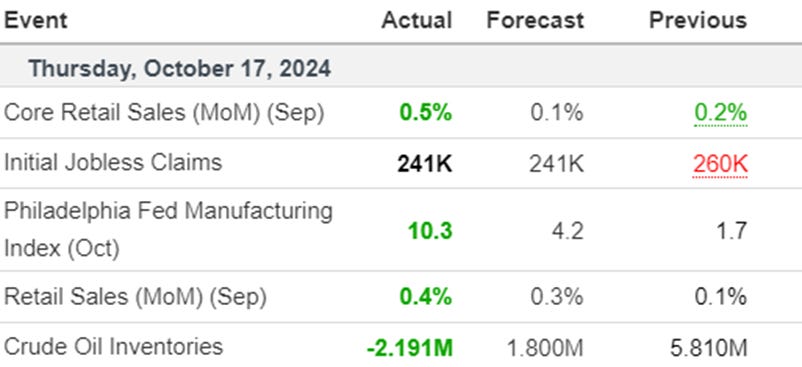
The upward shift in probabilities (move down in STIR price) through the last month is logical given the string of positive economic data implying continued growth. The market mood before the first cut was that the Fed had missed the boat (frequent citations of Sahm’s rule) and that growth was likely to see a substantial slowdown due to the Fed’s inaction and that a 25bps cut was not enough. I did not agree and framed it as follows:
Now, the market seems to think the soft landing is upon us (this has been our view for a few months now, albeit with some inflationary concerns), and equities are rejoicing.
Data from last week:
We have argued at length in the prior notes the following:
There will be fiscal spending put (a la Fed put), which will smooth over recessionary pressures. This is due to a shift from pro-capital economic policies to pro-labor. Governments, whether democratic or autocratic, realize that there is little tolerance for inequality-generating economic adjustments such as contractions in labor demand or wages. Fiscal spending which directs liquidity into the real economy has a direct and supportive impact to reduce the effects of economic impulses that increase inequality in a first order view.
The flip side of government-led deficits will be a regime of increased structural inflation volatility with a floor of 2% (this does not equate to a sustained inflation spike). Given that bond sensitivity to inflation increases with duration and sensitivity to growth decreases with duration, we have a neutral to negative view on long-duration bonds while using the short end as a growth hedge.
Even right now with improving outlook for growth the Federal government is accelerating spending (probably an effect of the election as a last ditch effort). The total federal debt jumped some $500billion early October, now bringing the total at $35.75TN.
I want to put some quick estimations around the rates term structure to frame the likely path for rates and what needs to happen to move them beyond their path of least resistance. This is also to respond to a couple of conversations regarding the long end of bonds being a good place to diversify an equity portfolio for growth scares.
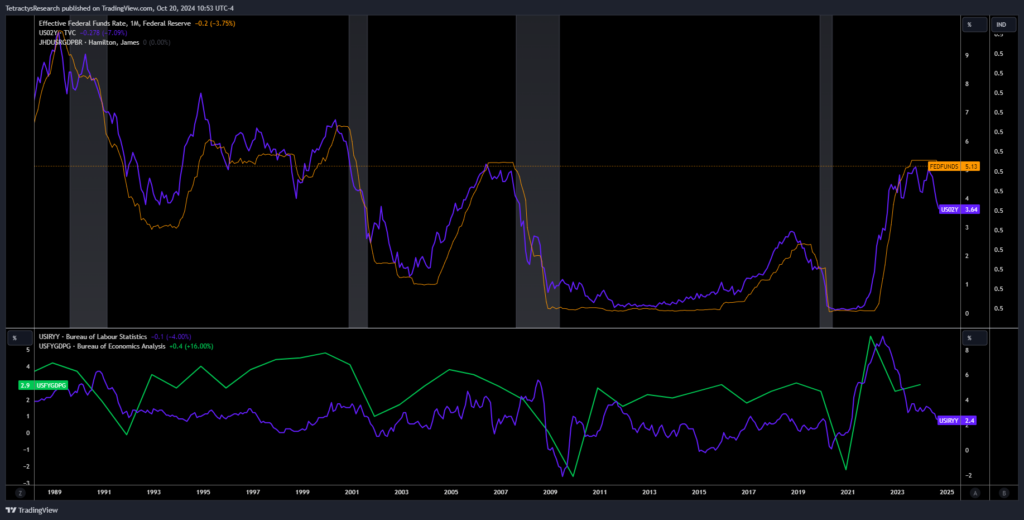
The chart below needs to stay in the background as we go through this exercise. I’ll make a few quick observations.
The 30-year has been on a constant bull market for some decades. Owning duration far out has been a good way to hedge recession risk.
Each time there is a recession, the 2s10s and the 10s30s steepen. That implies that the term premium for longer durations gets erased as capital moves to shorter durations.
The steepening also reflects the pricing expectation that yields on the front end will rally from fed funds rate being cut while the long end projects that economic growth will return and the Fed will eventually raise rates.
When looking at the real cost of money in the system, the rate that matters is the benchmark rate adjusted for inflation. The Fed typically looks to target a fed funds rate some 75-100bps over inflation assuming inflation is moderated and growth is sustained. We have a quick model of the inflation distribution under continued but slow growth which averages some 2.67% inflation. Historically the 2 year tracks fairly well 50 bps over the Fed funds rate in periods of inflation below 3.5% with economic growth while there is no expectations of Fed rate hikes, which lines up with our view on the economy.
Given we expect some 2.67% average running inflation (keeping in mind our inflation volatility arguments from prior notes), we can expect the terminal Fed Funds rate to be 3.5% in line with the STIR market. Then we can expect the 2 year to price at 4% which is where it prices today.
Then to look at the 10 year, we need to model the 2s10s spread jointly with the two year yield distribution. We model this as a multivariate beta distribution. The choice of beta here is to avoid tails towards infinity but rather towards a reasonable structural upper bound.
This allows us to derive the long-run 10-year yield distribution, assuming continued growth and increased inflation volatility. Here, we diverge from the market, given the current pricing of 4.1% vs. our 5.0% expectation. However, we do attribute a 20% chance of moving towards lower yields than where they are today (not insignificant), which is a risk we need to be cognizant of when putting on the short longer duration bonds. Our quick model does show that there is not much room for long rates to move lower, hence our focus on shorting the long duration bonds. This exercise does, however, provide us with a framework to formulate an exit condition to our inflation hedge. As we move closer to the mean, we will start taking off the hedge.
I suspect that the market currently demands little to no term premium due to a lack of inflation worries. The term premium can be interpreted as the pickup in compensation for inflation dragging on real returns of the bonds. The risk of lending to the U.S. government is not credit risk but inflation risk. Right now the market is stating that the U.S. treasuries have neither risk. This is where I believe the market is mispricing risk, and where we will put on risk.
Now let’s move away from our base case and model recessionary impulses in the economy which are met by insufficient fiscal stimulus. The steepening of the curve (empirically some 200bps) counteracts any benefit of holding long duration bonds:
Here is the impact on the 10 year distribution with no steepening. Looks like a good hedge.
But with the average of 200bps of 2s10s steepening we typically see during a recession, the hedge looks much less effective and we still expect rates at longer durations to sell-off in the long run, just at a decreased magnitude and probability from our base case. The 2s10s spread is modelled looking at the month on month change in its speed as a function of both growth and inflation. The general direction is a faster positive speed in change of the 2s10s as growth slows and faster negative speed as growth accelerates. Simultaneously, for stable and relatively slow growth, 2s10s widens as inflation picks up; its sensitivity to inflation reduces as growth moves away from positive low single digits.
You would essentially need a catastrophic event and growth well into negative territory accompanied with deflation for the long end to behave as a recession hedge. And even then you don’t even get 100bps of rally in your long duration yields; a significantly worse performance to the short duration bonds. Given our view on the political climate that justifies sovereigns to issue deficit spending in order to stave away growth slowdowns, this is a more remote possibility now. I will note that the long end here is calibrated on prior recessions, I suspect given the fiscal puts we can expect globally, the long end will perform worse than what is implied historically. Our severe downside to being short the long end is relatively muted, as such the trade has an excellent risk/reward.
It seems simpler to me to focus on shorter duration and credit spreads. We discussed the credit spread hedge here:
STIR butterflies from Yield curve flip flops
I am not willing to bet that credit spreads will widen substantially anytime soon, and hope to make money on it. However, I would want to buy meltdown insurance for as little carry as possible, given the tensions in the broad market with CDS spreads being relatively tight (CDS spreads should remain at these levels given my base case as outlined in the consumer outlook piece linked above, but I like to suffer less when I am wrong).
This is why we use the front end as a much cleaner representation of the recession risk, hence why we own bonds on the 2 and 5 year to hedge growth risk and short the long durations to hedge inflation, but this should be a great trade on its own.
If you find this insightful, please sign up to the notes and share with those who might be interested!
Cheers!


