Post-Election Implications and Trade Sketches
Here we go again, but not quite the same...
The week of November 4, 2024, was one for the books and possibly more significant than November 2016. During Trump’s first mandate, the major policy change his administration ushered in was a shift in China relations. This became apparent during VP Pence’s October 2018 Reagan-like speech criticizing China’s “whole government” approach to rivaling the U.S., denouncing the Uighur treatment, debt diplomacy strategy to acquire strategic assets in emerging markets, and plans for tech dominance by 2025. This stance on China, previously entrenched to select political class members in the swamps of Washington, is now mainstream on both sides of the aisle.
Trump also put on the public’s radar the possibility of protectionist economic policies in the hopes of a made-in-America industrial revolution. The primary tool to incorporate this economic policy shift was the China trade war, tariffs on steel and aluminum, 30-50% on washing machines, and tariffs on French Wine and Cheese (Sacrébleu!). The tariffs were implemented along with a tax and jobs act, designed to reduce the the tax burden and “right to work” policies in conjunction with broad de-regulation around banking, the environment and healthcare. Tax burden and “right to work” policies combined with broad de-regulation around banking, the environment, and healthcare. None of the policies instituted on the economy were fundamentally groundbreaking regarding their impact. The first trump administration also embarked on a mission to remove its military umbrella from its allies. However, this remained mainly in the domain of rhetoric, save for some 12k troops moved out of Germany.
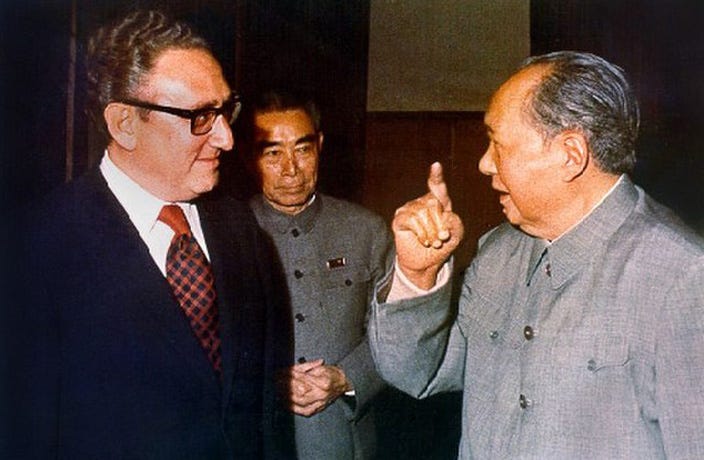
In this second term, we will likely see a re-invigorated, more focused, and more widely supported president. If the first term ushered in the most significant China-U.S. policy shift since Kissinger’s arrival to China in 1971.
It was also potentially a geopolitical shift in the league of the Marshall Plan, the 1990s shift to globalization, and the war on terror. What could be achieved with this second round?
I want to note that my job is not to agree or disagree with policy or politics nor debate what should be done. My job is to estimate the most likely paths of policy implementation and their ramifications in markets. What I do think is that Trump’s economic and geopolitical agenda, agree or not, good, bad, or nuanced, will create exciting and impactful trading and investment opportunities across geographies, which we will seek to capture.
So what can be achieved in this second trump presidency?

My wild guess is that Trump will come into office to finish what he has started. I expect a decisive and durable shift towards pro-labor economic policies away from pro-capital with protectionist policies. We have discussed the impacts of such pro-labor policies on various occasions focused on the notion of a federal fiscal spending put (à la Fed monetary policy put), and this political and social shift in the electoral climate has been one of our arguments justifying setting up the 2s10s bull-steepner since April, along with shorting on the 30-year and buying long-dated gold futures around the first Fed cut.
Quick rates update: one month anniversary
There will be fiscal spending put (a la Fed put), which will smooth over recessionary pressures. This is due to a shift from pro-capital economic policies to pro-labor. Governments, whether democratic or autocratic, realize that there is little tolerance for inequality-generating economic adjustments such as contractions in labor demand or wages. Fiscal spending which directs liquidity into the real economy has a direct and supportive impact to reduce the effects of economic impulses that increase inequality in a first order view.
Quick rates update post NFP
Our view on inflation comes from a pro-labor environment in which governments prioritize deficit spending in lagging sectors of the economy over fiscal discipline at the expense of growth in those industries. The objective behind this politically popular economic policy shift is to avoid corrections in the labor market, both in quantity and wages, by providing capital for those industries that would contract otherwise and maintain full employment and growing wages. The tradeoff of policy shifting away from being pro-capital to pro-labor comes in the shape of the structural risk in the economy moving away from growth to inflation. We concluded in the prior note that U.S. inflation will maintain above the 2% target while its volatility will remain heightened (hence our view to short long duration bonds).
Fed and China go big or go home
A compelling argument in favor of a pickup in inflation comes in the form of the shift in economic policy from being pro-capital to being pro-labor, where stagnation in wages in real terms (both adjusting from inflation and international purchasing power from FX) is little tolerated by the electorate. Policies that provide fiscal stimulus by increasing spending and borrowing in order to smooth over recessionary impulses, hence, a reduction in the quantity of employment and purchasing power are taking the front seat in driving the economy.
I also expect the U.S. military umbrella to shrink dramatically, forcing U.S. allies, namely Europe, to increase spending, improve coordination, and work to secure strategic autonomy, first with defense and energy but also access to computing, artificial intelligence, and the space economy. We kicked off this discussion around the space economy and European autonomy with our first thematic equities primer. Following a detailed review of the industry, the universe of solutions Europe provides to the space problem still has a long way to go before being competitive with the U.S. and China.
Thematic Equities: Star Wars – A New Hope
Europe’s defense strategy has always been a bit… scattered. But with increasing security concerns, the EU is finally seeing the importance of stepping up its own defense game. In 2023, the EU hit €265 billion ($281 billion) in defense spending, equal to about 1.55% of the region’s GDP. Sure, it’s not quite at NATO’s target of 2%, but the trajectory is pointing up. Major players like Germany, France, and Poland are ramping up their defense budgets by 10% or more every year through 2025, trying to reduce their dependence on the U.S. and bring more capabilities under the European roof.
The next Star Wars article focused on the defense sector will review the European military-industrial complex’s competitive advantage and why we have a thematic equities basket allocated explicitly to the European push towards defense autonomy.
One thing is certain: regardless of what is achieved during this presidency, fiscal deficit spending is here to stay and will likely accelerate.
What world order will we leave behind?
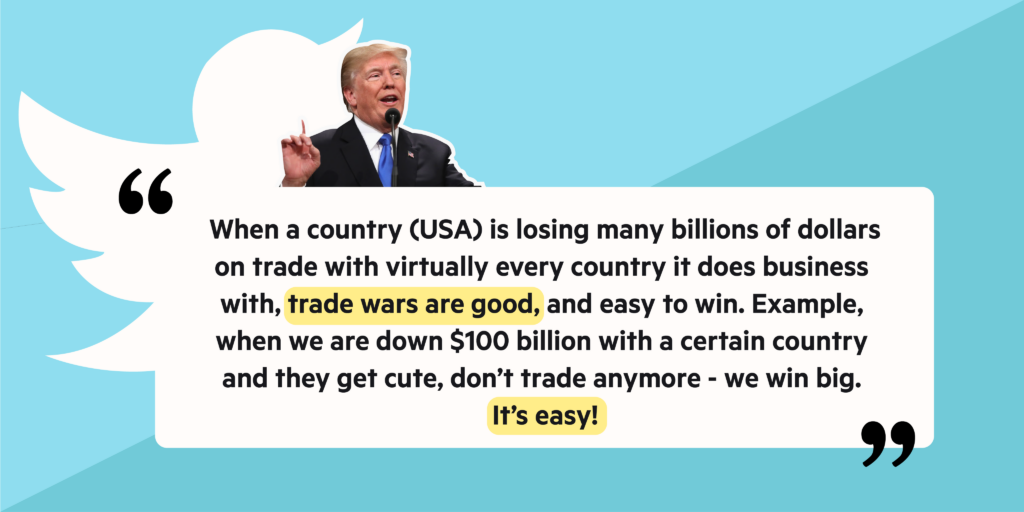
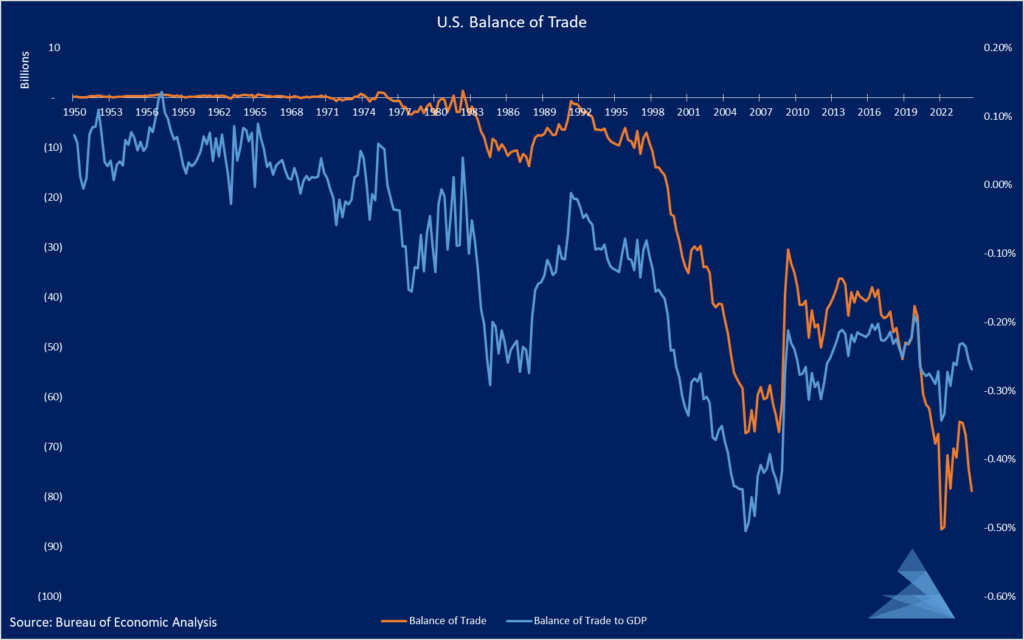
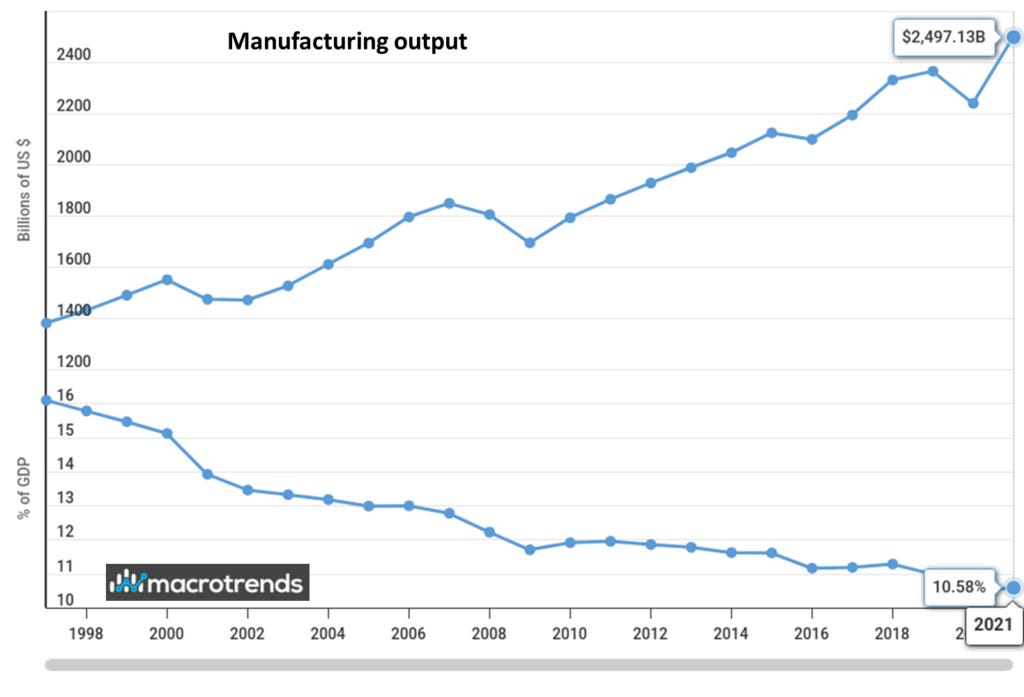
One of Trump’s main gripes and campaign focus points is the U.S. trade deficit.
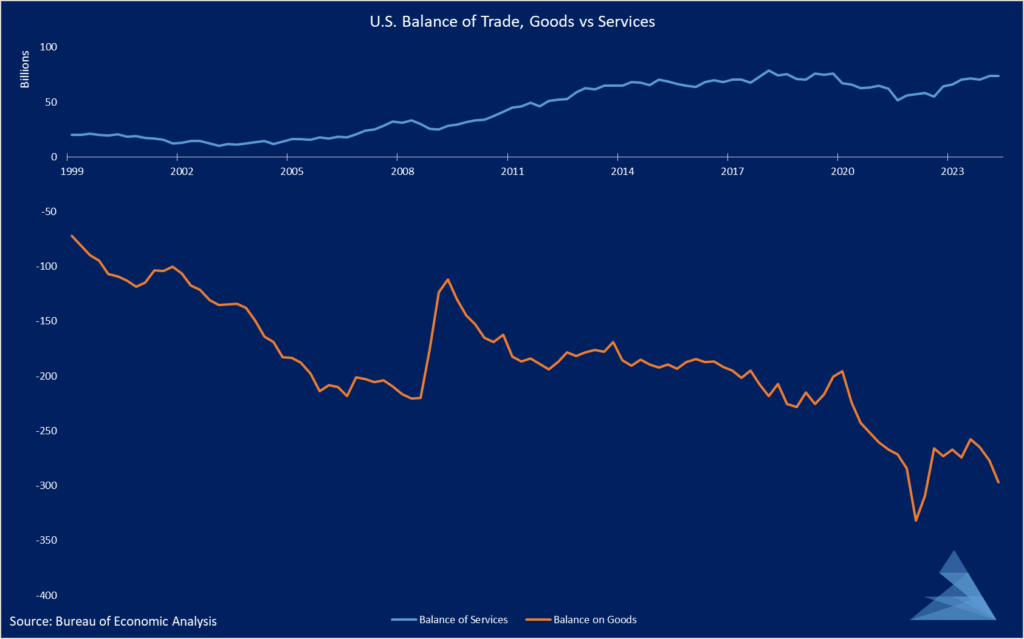
The balance of trade is currently at a $80bn deficit, one of its lowest historical points. However, as a percent of GDP, it has actually been rangebound since the 08 GFC, with 2005 being the year when the trade deficit had its heaviest weight as a percent of GDP.
If we split the balance between goods and services, we note that the U.S. is an exporter of services while increasingly dependent on imported goods.
From his economic agenda, he is clearly laser-focused on addressing the goods part of this equation. This makes sense, as it is not the jobs of Mag-7 salaried employees that “need” re-shoring but that of blue-collar workers, the pillars of this socio-political shift towards pro-labor policies.
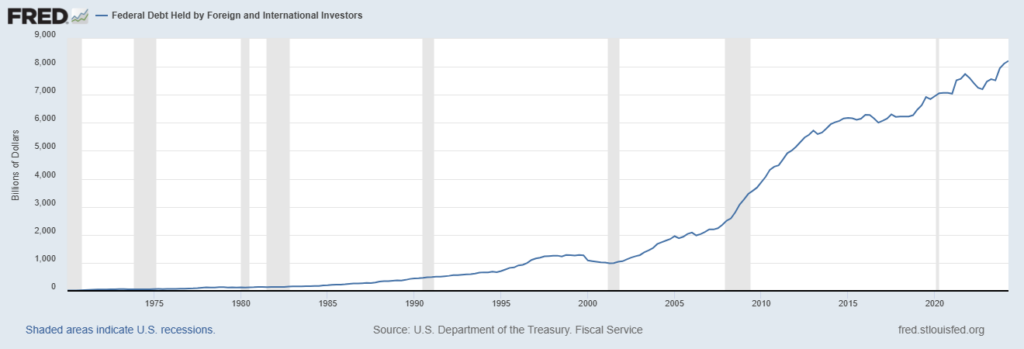
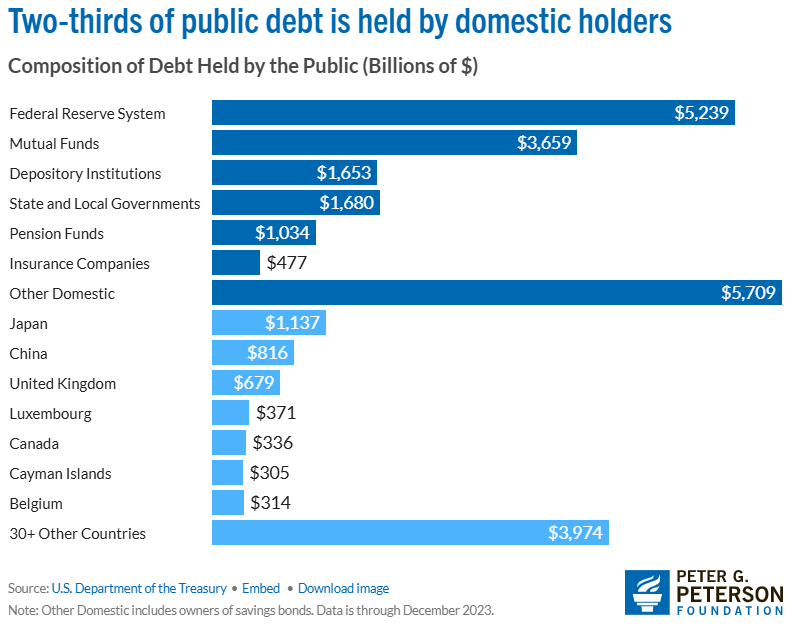
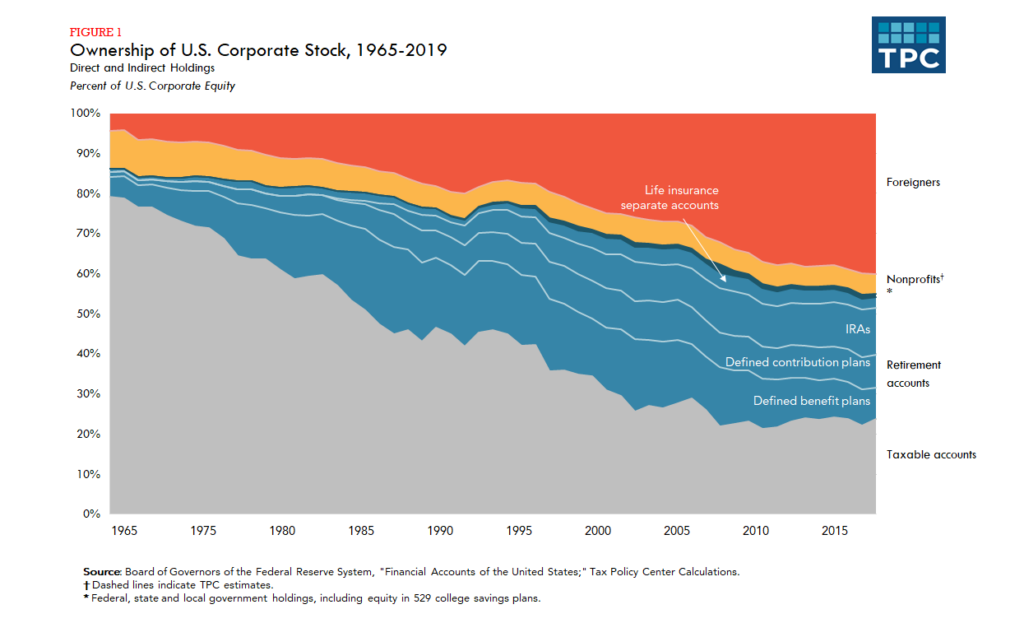
One piece of the puzzle that seems to fly under the radar and not accounted for in the campaign calculus is that the U.S. is an exporter of financial assets. Let’s let some graphs speak for themselves:
This relationship between America and the rest of the world where the U.S. exports services and financial assets while importing goods makes apparent one thing. The dollar’s strength is in part due to this dynamic. As foreign countries export goods to the U.S., they park the dollars they receive into American financial assets. Which leads us to another gripe on the weakness of foreign currencies relative to the USD:
As for most things in the natural world, there is a tradeoff. While the U.S. could obtain cheap goods today in exchange for the promise of more dollars in the future, putting an eternal bid on the USD; it created a bifurcation in the economy between the haves and the have-nots. The haves are those who work in services that are exported globally, able to benefit from both increased economic growth and cheaper goods. The have-nots are the blue-collar workers who had their jobs exported or their wages compressed in exchange for those more affordable goods.
This was the pro-capital world where financial assets and capital could trade with minimal friction and allow wages and economic output compression and expansion. This meant that it would be less and less likely to work your way into the American dream; the key was being an owner of equity as return on equity was being generated at the cost of return on labor. The second part of this relation is precisely what the incoming Trump administration will attempt to reverse, hence a move to pro-labor economic policy. This will be a fundamental change to the structure of the U.S. economy if achieved and with dramatic re-pricings of assets across the board.
I believe in a simple economic idea: if it is more profitable for corporations to do something, they are likely already doing it. If they are constrained to adapt their economic approach, someone will bear the burden of this transition. The current status quo has been a blessing to American corporations relative to the rest of the world, benefiting from flexible labor forces worldwide.
Here are some questions I have that will be clarified as policy takes shape.
Will the pro-business deregulations sufficiently counter the pro-labor shift’s impact on the bottom line for U.S. manufacturing companies?
Are U.S. equities going to be negatively impacted by protectionist policies that reduce the trade deficit and, hence, the allocation of earnings in USD to U.S. financial assets?
I want to explore trades that don’t require further clarification from the data we have today. These ideas have the most asymmetry and benefit from the general direction of policy rather than its specific implementations.
What trades does a pro-labor and protectionist U.S. provide?
U.S. treasuries will be in a secular bear market and the curve will further steepen
Reference our various articles on the subject:
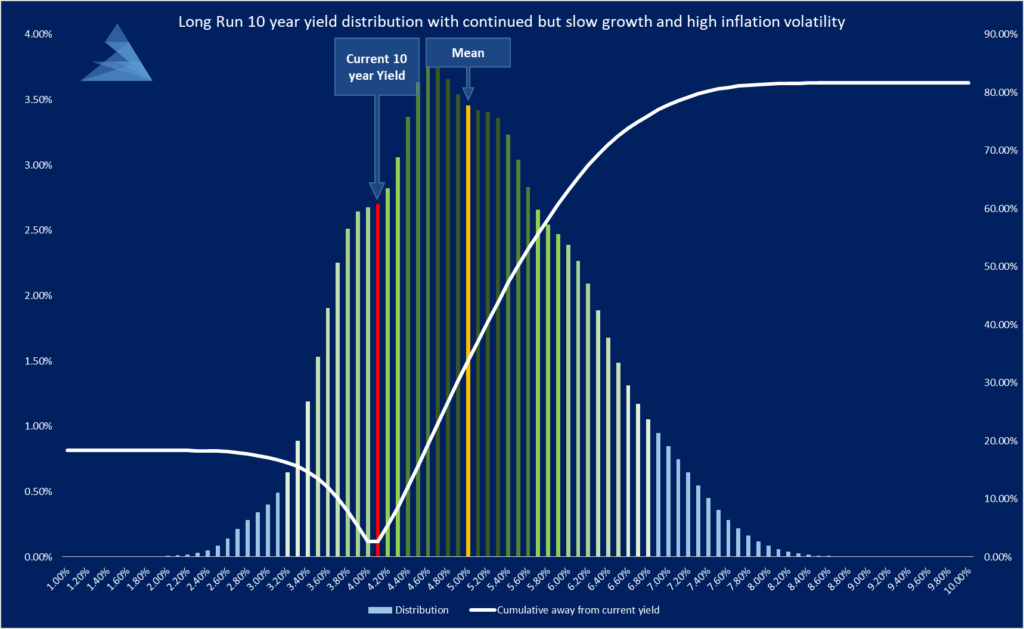
I am interested in the 2s10s steepner and short the 30-year outright. Our current profit-taking target for the outright short is when the 10-year yield gets to 5%. This was modeled by ignoring Trump-specific policies and only focusing on fiscal deficit spending, which was common to both presidential candidates. I expect the protectionist policies will accentuate further inflation volatility, and hence, our price target could be moved up. I also take profit on the trade to keep the short at 3.5%-4% of NAV (I use long-dated 25-10 delta put spreads on ZB to express this trade). I use those profits to put on the 2s10s steepner which is now at 3% of NAV.
But let’s not forget that the Japanese invented yield curve control in September 2016. Given Trump has at length criticized the Fed for embarking on a path to raise rates, it is not inconceivable that Trump finds the right people to put on the Fed board that would be willing to act not only on the short end but across the curve to control borrowing costs.
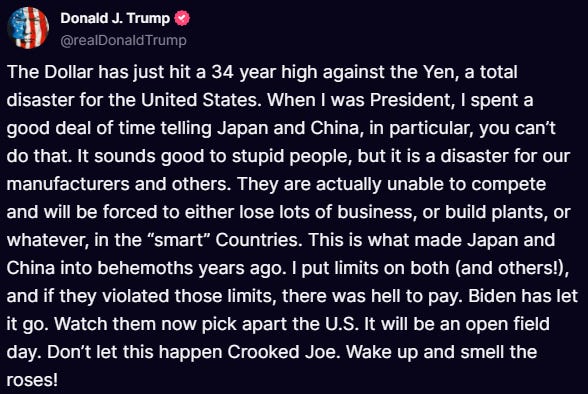
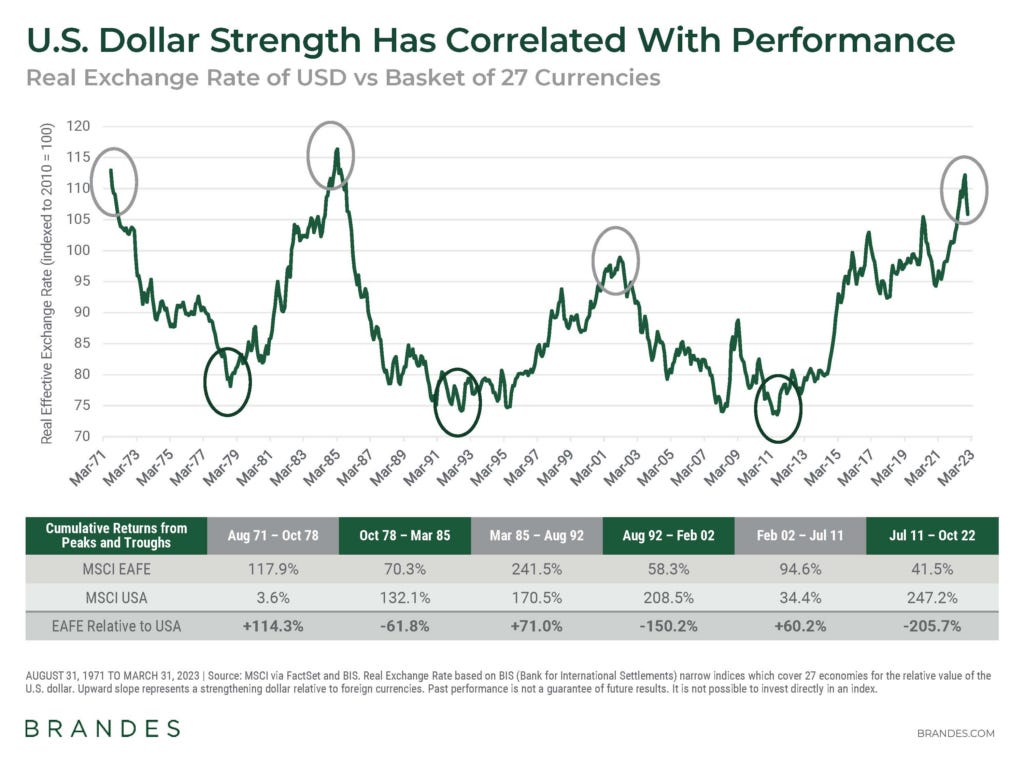
The dollar/YEN will enter a secular bear market and possibly the dollar more broadly.
This is an explicit policy objective of the Trump administration: to improve goods exporting competitiveness and incentivize corporations to bring labor back stateside. Remember when we talked about who bears the burden of the costs of this transition? An obvious one is increased prices on imported goods due to the weakening dollar, which impacts consumer spending. We did a deep dive on consumer health in this report, if anything changes substantially, it will be updated.
What is the likely path for growth now? – What is my credit card limit?
To understand the current state of the economy and estimate which sectors are set to outperform this cycle, we need to take a look at where everything starts… the American consumer. After all, what’s the point of credit card debt if not to buy H100 pro max’s?
But how will weakening the world’s reserve currency work? Given the continued real growth of the U.S. economy and the strength of its service sector, which is a sponge for foreign capital, the frictionless path for the dollar is to remain where it is.
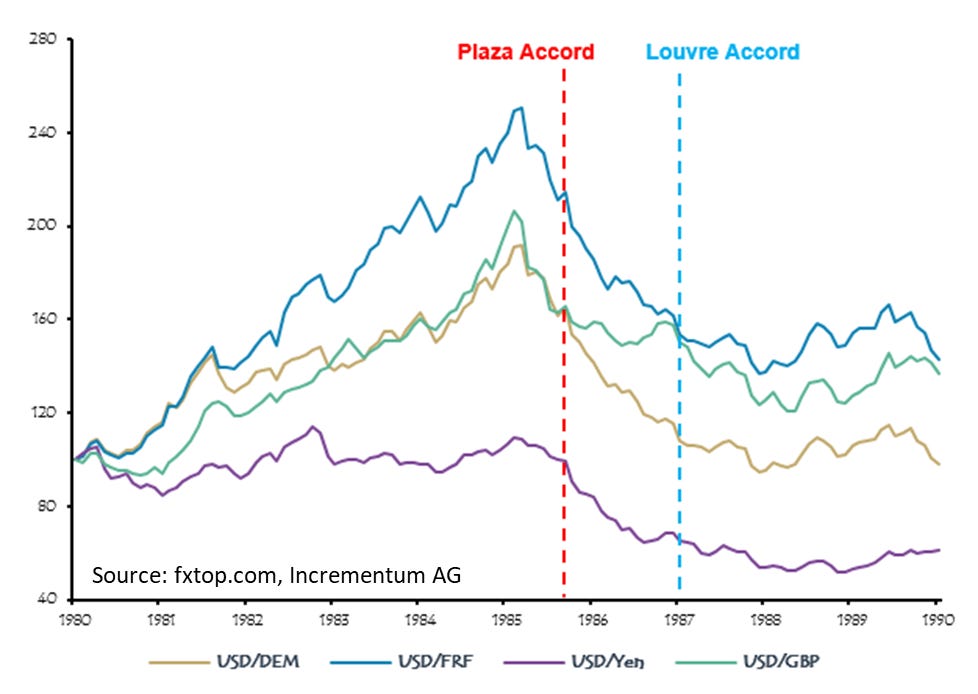
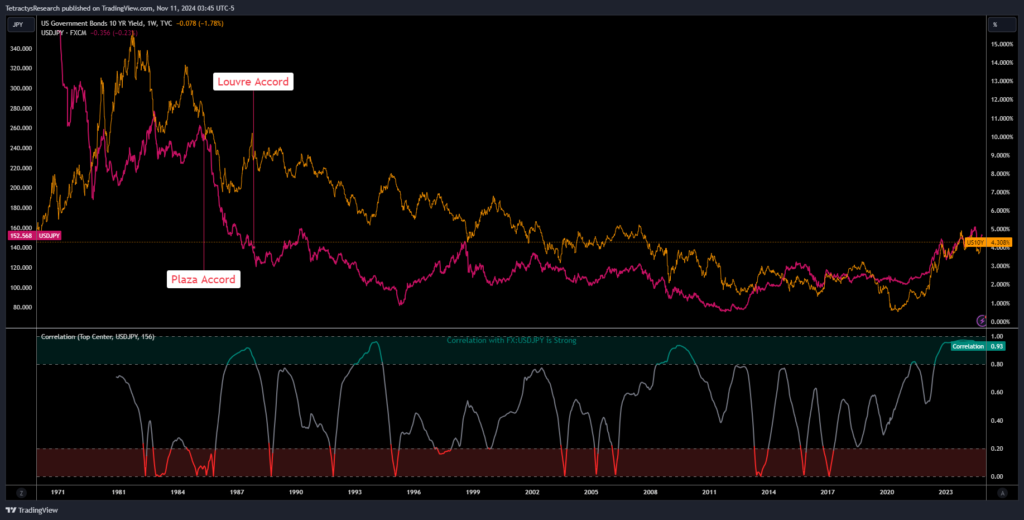
The first thing that comes to mind is a Plaza Accord round 2.
The Plaza Accord of 1985 was an first of its kind deal between the United States, Japan, West Germany, France, and the United Kingdom to tackle some serious economic headaches of the time. By the mid-1980s, the U.S. dollar had become so strong that American goods were priced out of international markets, creating a huge trade deficit and putting pressure on U.S. manufacturing jobs. Meanwhile, countries like Japan and West Germany had economies heavily dependent on exports to the U.S., and this imbalance was straining everyone. The solution? An ambitious, coordinated effort to bring down the value of the dollar and boost other currencies, aiming to level the playing field and ease some of these global pressures.
Under the Plaza Accord, the five nations agreed to take action in the currency markets, actively working to lower the dollar’s value and raise the value of the Japanese yen and German Deutsche Mark. It worked—within two years, the dollar dropped by around 25%, which made U.S. exports cheaper and somewhat improved the trade balance. But while this was good for American exporters, it threw a wrench in Japan’s export-driven economy.
The Plaza Accord was both a triumph and a cautionary tale. On the one hand, it showed how much could be achieved when major economies worked together—proof that currency intervention could work if everyone was on the same page. On the other, it highlighted the risks and unintended consequences of such a move. Japan’s struggles in the wake of the Accord underscored how even well-coordinated policies can ripple out in unexpected ways.
The Plaza Accord’s impact on Japan was transformative, sparking drastic economic shifts backed by stark numbers. After the agreement, the yen appreciated from 240 yen per dollar in 1985 to 128 yen per dollar by 1988—a nearly 50% rise that severely impacted Japan’s export-driven economy. To offset this shock, Japan’s central bank slashed interest rates, dropping from 5% in 1985 to 2.5% by 1987, which fueled an investment frenzy. The result was a historic asset bubble: the Nikkei 225 stock index soared from roughly 13,000 points in 1985 to nearly 39,000 by 1989, while commercial real estate values in Tokyo tripled. When the bubble burst in 1990, Japan’s economy fell into turmoil. The Nikkei lost over 60% of its value from its peak, urban land prices plummeted, and GDP growth slumped to below 1% by 1995, far from the 4–5% growth rates of the early ’80s. Japan’s debt-to-GDP ratio also surged, doubling from around 50% in the mid-1980s to over 100% by 1997 as the government tried to revive the economy. The Plaza Accord’s legacy remains a cautionary example of how sweeping currency adjustments can reshape an economy for decades.
A Mar-a-lago accord (plaza round 2) might be more challenging to install than its predecessor, given the potential to repeat the Japanese experience, and that is without mentioning that China would need to be a part of any agreement of this kind. I suspect the trump administration will use the threat of trade wars against various countries to attempt such coordination, but some goods exporting/manufacturing countries might prefer to bite the bullet of tariffs rather than currency appreciation.
Okay, great. Given the uncertainty in executing this Dollar devaluation, why put on a short USD long Yen trade? This is likely the most asymmetric currency pair for a few reasons. I’ll jot out some bullet points, but this deserves a full primer.
It is a form of protection against another carry trade unwind, so we can look for it as a hedge against our long positions in U.S. tech and services.
The BOJ has a line in the sand at 160; further weakening in the yen could complicate already weak consumer spending in Japan and raise energy prices, impacting the JCC (Japan Crude Cocktail / Japan Custom Cleared) in dollar terms which has been higher than the central bank target for the past 3 years.
I don’t mind buying some cheap yen now to make sure I get a good bang for my buck on my next Japan trip.
Central bank benchmark rate differential between the Fed and BOJ will be narrowing (although I suspect that the Fed won’t be able to cut as much as they anticipate due to inflation and the BOJ to hike as much as they would like)
I also acknowledge that a long yen position is somewhat at odds with my bearish view on long-duration U.S. treasuries, but that also makes it a convenient hedge to our treasury shorts.
There is a reason for this relationship. Japan was a pioneer in the purchases of U.S. Treasuries for its reserves rather than gold, which began in the 1980s and grew rapidly as Japan’s trade surplus with the U.S. surged, hitting over $46 billion by 1985. This trade imbalance brought vast inflows of U.S. dollars into Japan, which the Japanese government often used to buy U.S. Treasuries after intervening in currency markets to keep the yen from appreciating too much. By selling yen and buying dollars, Japan could stabilize the yen’s value, making its exports more competitive. Treasuries offered Japan a safe, liquid way to hold its dollar reserves, making them ideal for managing these large inflows without disrupting exchange rates.
This approach helped Japan build a significant buffer of foreign reserves—essential for economic stability, especially after the 1997 Asian Financial Crisis underscored the need for such protection. By 2000, Japan’s foreign exchange reserves were near $350 billion, with a large portion in Treasuries, and by 2012, Japan’s Treasury holdings had surpassed $1 trillion. These reserves acted as insurance against speculative attacks on the yen. Today, Japan consistently holds around $1.1 trillion in U.S. Treasuries, making it one of the largest foreign holders, often trading the top spot with China. This explains the correlation between the Yen and U.S. treasury yields. This leads us to our last bullet point supporting the trade.
This correlation is what I expect to break during Trump’s second mandate due to a fundamental change in trade relations between the U.S. and the rest of the world that directly impacts Japan. This is how I cognitively justify bearish views on U.S. treasuries but bullish on the Yen. If the correlation does not break due to failed trade policy changes, we could have at least an effective hedge against being wrong on Treasuries from inflation volatility, potentially moderating.
Commodity exporting economies
Given my bearish view of the dollar, one natural extension of this thesis is through equities in geographies that are net exporters of commodities. Two core ideas back this thesis.
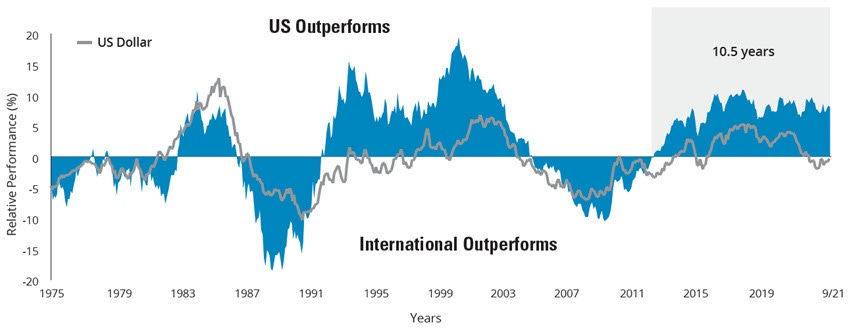
The trading multiples on U.S. equities and Foreign equities will start converging.
The U.S. has sustained a growing trade deficit, reaching $916.8 billion over the last year. This nearly trillion-dollar gap means the U.S. imports significantly more than it exports, with foreign countries accumulating and reinvesting these dollars in U.S. financial markets to fill the funding gap.
Foreign holdings of U.S. financial assets—including Treasuries, stocks, and corporate bonds—have grown to over $33 trillion as of 2023. These substantial inflows have been pivotal in driving up demand and supporting high asset valuations in U.S. markets.
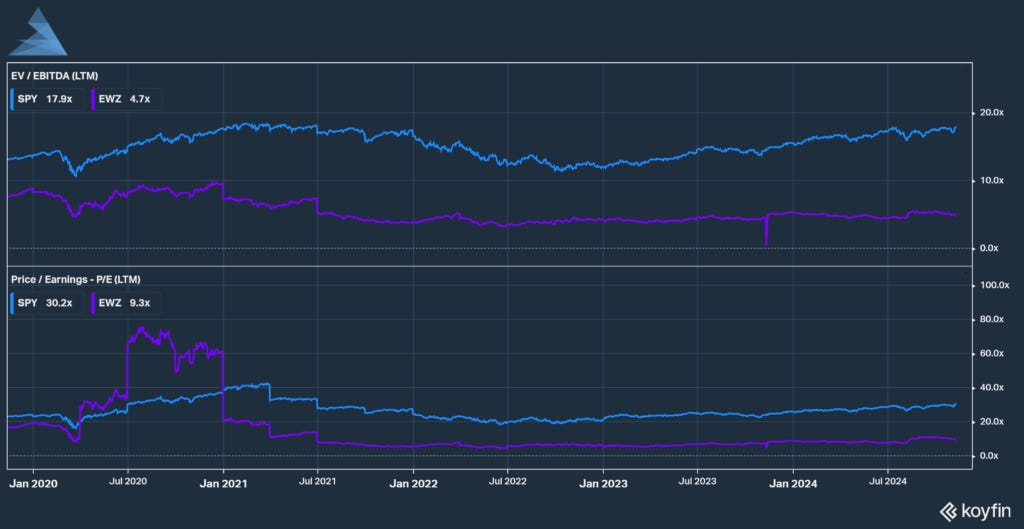
U.S. stocks trade at a significant premium over global markets. The S&P 500’s P/E ratio is 27.5x earnings, while Europe’s Euro Stoxx 50 is around 15x, and emerging markets often have P/E ratios closer to 10x. This premium is partly fueled by steady foreign capital flows seeking returns in dollar-based assets.
A weaker dollar boosts the appeal of international equities for U.S.-based investors, as currency gains add to potential returns. This can lead to increased capital flows out of U.S. markets, pushing U.S. and international valuations closer together.
Since high U.S. stock valuations are largely supported by consistent foreign inflows tied to the trade deficit, reducing this deficit could bring U.S. P/E ratios closer to global averages. A shrinking dollar advantage could make international equities more attractive, driving capital outflows and reducing the valuation premium on U.S. stocks.
A weaker dollar leads to stronger commodities and strengthens commodity exporting countries
Commodities priced in dollars become cheaper globally when the dollar weakens, boosting demand. For example, the U.S. Dollar Index (DXY) fell about 10% from mid-2020 to early 2021, during which time oil prices rose nearly 80%, from $40/barrel to over $70/barrel, reflecting increased demand fueled by dollar weakness.
Gold, oil, and agricultural products often surge with a weaker dollar as they’re dollar-denominated. Historically, a 1% drop in the dollar index has corresponded with an average 0.5-1% increase in gold prices. This relationship supports commodity-exporting economies, as higher global demand boosts their revenue from exports.
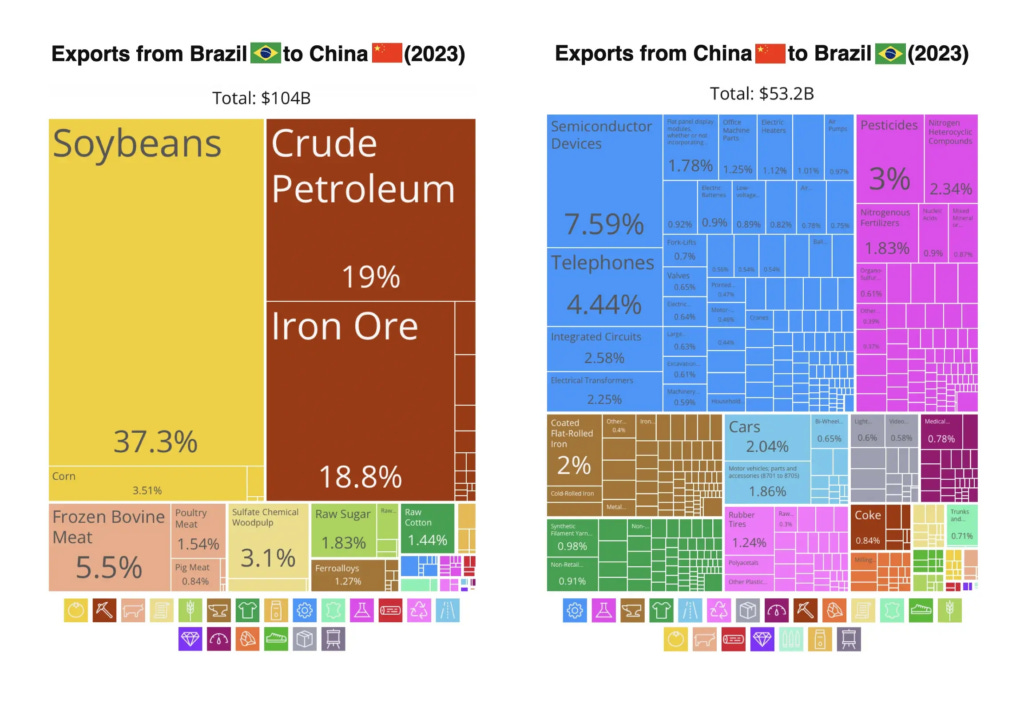
Commodity-exporting nations experience increased revenue in local currency terms as prices rise. In 2022, Brazil—a major exporter of soybeans, iron ore, and oil—saw its export revenues grow by 19% with a weaker dollar boosting commodity prices, contributing to 2.9% GDP growth that year despite global headwinds.
Currency appreciation for commodity-exporting countries like Canada, Australia, and Russia often follows a weaker dollar, as demand for their exports grows. For instance, during a dollar decline in 2017, the Canadian dollar appreciated by 8%, benefiting from rising oil prices, which contributed to 3% GDP growth that year for Canada.
Emerging markets with commodity-heavy exports, such as Chile (copper) and Indonesia (nickel and palm oil), often outperform when the dollar weakens. In 2021, Chile’s copper exports reached $53 billion, a record high, as copper prices surged over 25% with dollar weakness, fueling GDP growth of 11.7%.
These two views converge to propose a unique macroeconomic setup that could spell a multi-year run for commodity-exporting countries.
Brazil seems especially well positioned to benefit
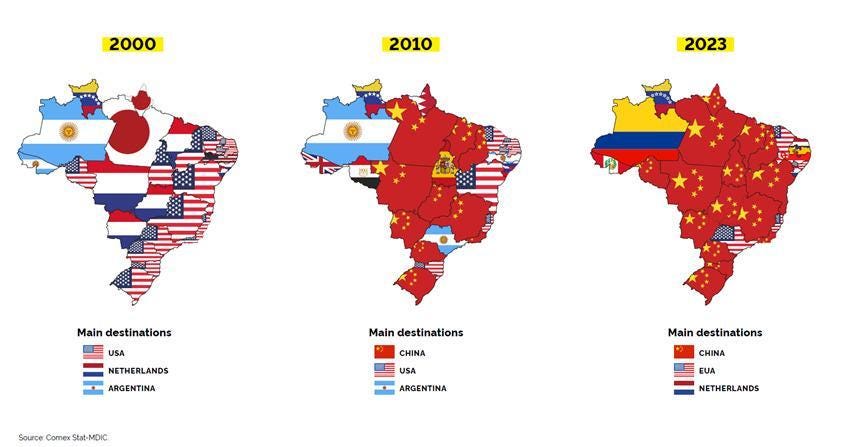
Brazil’s economy is heavily dependent on global commodity markets, with exports of soybeans, iron ore, oil, coffee, and sugar making up nearly 60% of total exports and contributing around 10% to GDP. In 2023, Brazil achieved $335 billion in export revenues, benefiting from robust demand in commodities. As the world’s largest soybean exporter and a major exporter of iron ore and oil, Brazil’s economic health remains closely tied to global demand, particularly from China, its largest export partner, which absorbs over 30% of Brazil’s exports. This deep connection to global commodities provides Brazil with both growth opportunities and risks, depending on international market trends.
The Brazilian real’s strength often mirrors global commodity cycles and dollar fluctuations, with significant impacts on inflation and trade. For example, in 2023, periods of dollar strength pressured the real, making exports more competitive but raising import costs and driving inflation up to 5.6%. In contrast, a weakening dollar phase strengthened the real, helping to stabilize inflation and improve affordability for imported goods. This currency sensitivity directly affects economic stability, as inflation and purchasing power respond closely to dollar movements.
Despite this dependency on commodities, Brazil’s stock market, the Bovespa Index, trades at a discounted valuation, with a P/E ratio around 9x, compared to the S&P 500’s 27.5x. This low valuation reflects both market risks and potential for growth, particularly if commodity demand remains strong. Domestic sentiment toward Brazilian equities, however, remains pessimistic; a dramatic rotation from equities to fixed income has taken place as the Brazilian Central Bank’s tightening raised real rates to 6.2%. This has fueled local investors’ preference for bonds, which, by comparison, would yield nearly 9% nominal—an attractive proposition in a historically fixed-income-dominated domestic market. However, with real yields high and sentiment at lows, Brazilian equities may offer substantial upside potential.
Brazil’s economy is moderately diversified, with 65% of GDP from services and 20% from manufacturing, but commodities remain crucial. The country thrives during commodity price booms, such as in 2021, when Brazil’s economy grew by 4.6%. Conversely, downturns in commodity prices present risks to GDP growth, trade balances, and inflation. The ongoing high real rates could slow domestic inflation, making space for the Brazilian Central Bank (BCB) to ease rates, which could attract new equity inflows as rate cuts are anticipated.
Politically, Brazil faces potential shifts, especially with the 2026 election on the horizon. If, as many anticipate, Brazil swings back to the right with a pro-business successor to Bolsonaro, the market may experience a boost similar to Argentina’s Milei effect. This scenario could offer substantial upside given Brazil’s deeper financial markets and higher liquidity, which would allow for larger institutional inflows compared to Argentina. In this context, the Brazilian equity market offers convexity: if political reforms align with a pro-business agenda, Brazil could attract major foreign capital inflows, particularly if sentiment around fiscal stability improves. Even if political conditions remain steady, Brazil’s fortunes will likely still hinge on commodity performance, limiting downside risks.
The EWZ ETF provides a diversified entry into Brazil’s economy, yielding around 7% in dividends, allowing investors to benefit from Brazil’s growth potential while collecting income. With notable cross-currency divergences and foreign investors reducing allocations to Brazilian equities, the setup resembles past buying opportunities, where both local and foreign sentiment was low. Combined with Brazil’s economic sensitivity to global commodity cycles and potential political shifts, Brazilian assets offer a compelling case for growth-oriented investors. A key downside to monitoring the Brazilian story is China’s balance sheet recession covered at length here:
Fed and China go big or go home
This story can be summarized with the term: balance-sheet recession (idea formulated by Koo in 1996). What is it? A typical recession, as the one investors are currently worrying about in the US, is caused by overproduction or rising inventories, decreasing consumer spending, inflationary pressures, and corporations being profit-maximizing; this forces job losses, productivity declines, and reductions in growth. Now, balance sheet recessions have the odd behavior that corporations stop being profit-maximizing but rather debt-minimizing, even with extremely low or zero interest rates.
Here is an other interesting geography to consider:
Argentina, ARGT
Primary Commodities: Argentina’s economy is driven by exports of soybeans, soybean products, corn, wheat, beef, and increasingly, lithium. Together, agriculture and commodities contribute around 10% of GDP and account for over 60% of total exports. Soybeans and soybean products alone make up roughly 30% of Argentina’s exports, positioning the country as one of the world’s leading exporters of these critical crops. Demand from major importers like China directly impacts Argentina’s trade balance and economic stability, given its sensitivity to global agricultural prices.
Emerging Mining Sector: Argentina is making substantial moves to expand its mining sector, particularly in San Juan Province, which is now positioned as one of the country’s premier mining regions. The province has attracted significant foreign investment due to its pro-mining policies and abundant mineral resources, especially in lithium and precious metals. Argentina’s lithium reserves, largely located in the Lithium Triangle, are crucial as global demand for electric vehicle (EV) batteries continues to rise. In 2023, lithium exports grew significantly and are expected to account for an increasing share of export revenue, making lithium a valuable diversification from agriculture and a hedge against agricultural price volatility. San Juan’s gold and copper mining projects further add to Argentina’s portfolio, supporting the broader narrative of Argentina as a diversified commodity exporter. Argentina is also diversifying with a growing industrial and energy sector, including oil production in the Vaca Muerta shale formation.
Inflation Pressures: Argentina’s economy is highly inflationary—recently recording inflation rates near 120% annually—and fluctuations in agricultural prices or adverse weather conditions, like droughts, can strain fiscal positions and exacerbate inflationary pressures. With the mining sector’s growth, Argentina has another avenue to accumulate foreign currency, which could provide more stability to the peso and help manage inflation pressures.
With two more years of Milei in power, there is still room for the Argentine trade to run. I would focus on its mining opportunities for additional torque.
Along the trump v2 repricing theme, here are other trades that I find interesting, which I will leave here without too much additional explanation (potentially future notes)
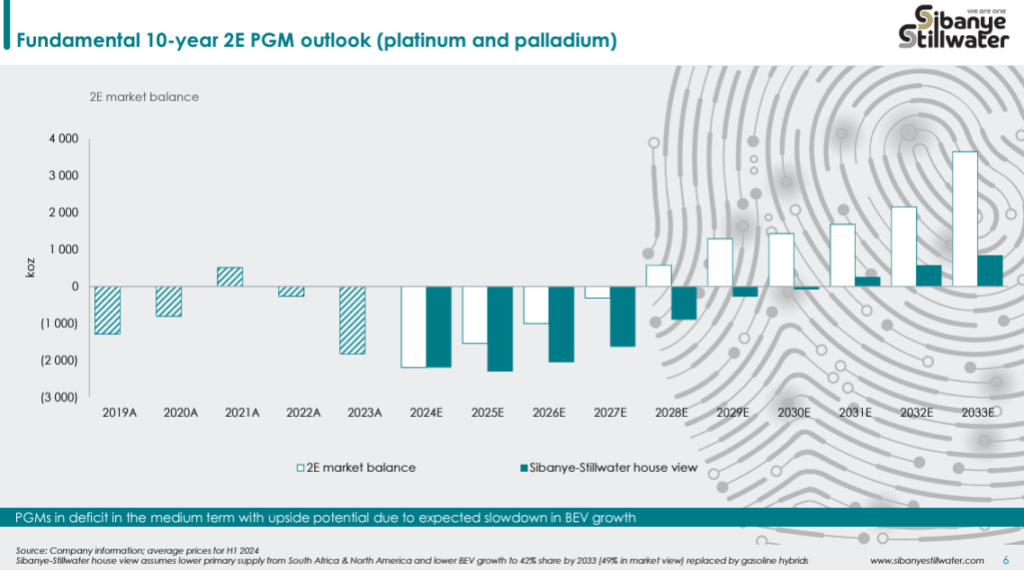
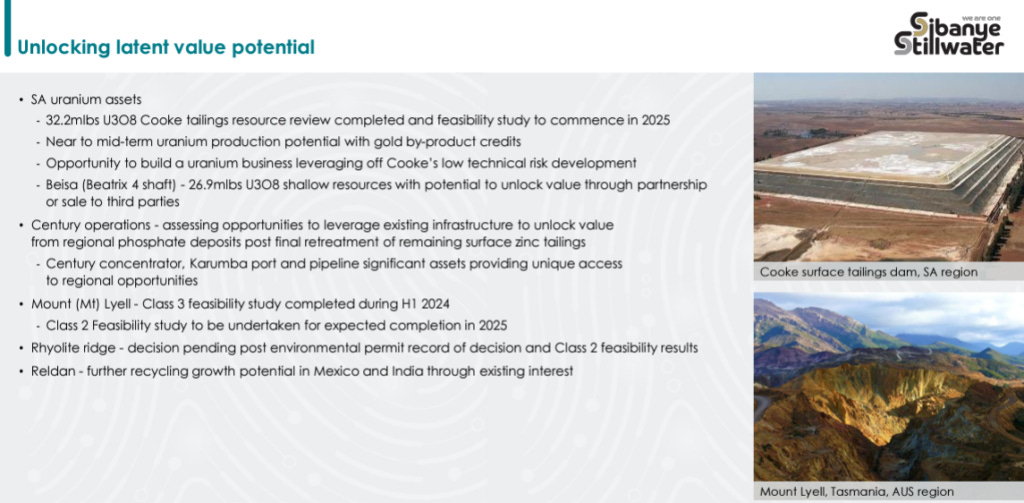
Sibanye Stillwater, South African platinum group metals miner with additional exposure to Gold and uranium.
Strong Leverage to Precious Metals Upside Amid Depressed PGM Prices: Sibanye is a major player in PGMs (platinum, palladium, rhodium) and gold, with substantial upside as these metals rebound from multi-decade lows. PGMs, trading at historic discounts, offer significant asymmetry; for example, platinum is trading at a 60% discount to gold—the largest discount on record. With supply constraints and strategic demand from hybrid vehicles, Sibanye is well-positioned for price recovery.
Strategic Geographic Hedge and Production Diversity: Sibanye’s U.S. operations, comprising 21% of PGM revenue, provide a hedge against political risk in South Africa, which produces 80% of global platinum. Although U.S. operations are currently loss-making on an all-in basis, their potential closure could tighten the palladium market by 7%, supporting prices. This operational flexibility mirrors strategies in other commodities, such as Cameco’s uranium production management.
Structural “Economic Moat” from Low-Cost, Debt-Free Assets: Post-restructuring, Sibanye holds assets at a fraction of replacement costs, creating an economic moat. For instance, its $16 million per OSV replacement cost is significantly below the $70 million newbuild cost, giving it a competitive advantage as new market entrants face prohibitive initial costs, limited shipyard space, and financing burdens.
Robust Supply Constraints: PGM supply growth is flat, with platinum production capped at 7.1 million ounces in 2023 (of which 1.5 million ounces came from recycling). With no significant new supply expected, PGMs are set up for a supply-demand imbalance, particularly if hybrid vehicles continue to outpace EVs. Hybrid engines require 10-15% more palladium than traditional ICE vehicles due to more frequent start-stop cycles, adding an unexpected demand tailwind for palladium and rhodium.
Resilience in South African Political Environment: Despite South Africa’s political volatility, recent coalition changes have eased risks of nationalization and over-taxation. Sibanye’s management, led by experienced CEO Neal Froneman, has a track record of successfully navigating this challenging environment. Furthermore, the company’s significant operations in South Africa, combined with proactive security investments, allow it to continue operations effectively despite regional risks.
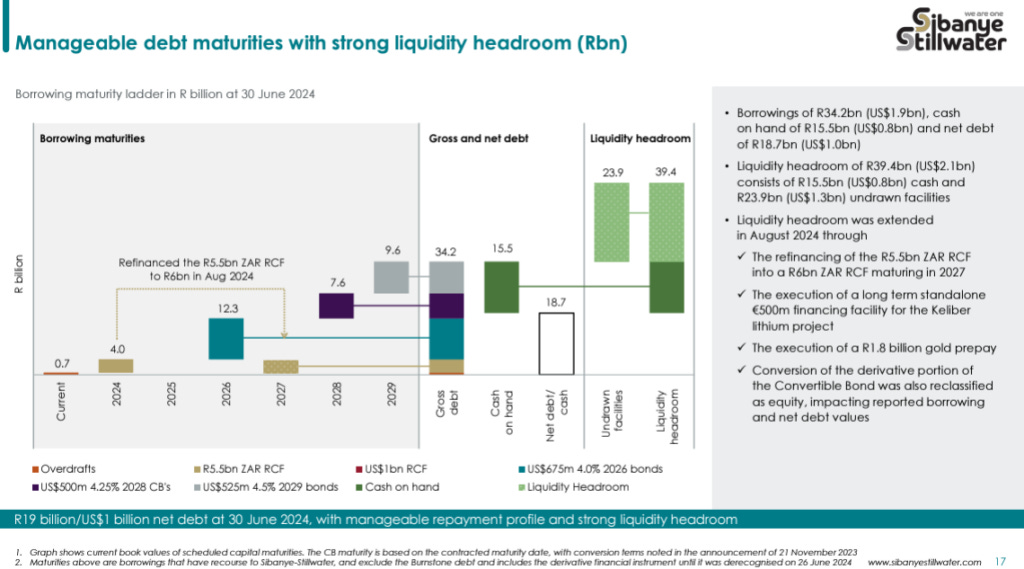
Liquidity and Cost-Cutting for Downside Protection: Sibanye maintains over $1 billion in cash and a $1 billion undrawn credit facility (maturing in 2026), providing ample liquidity. The company has implemented strategic cost cuts, including shaft closures and asset restructuring, enhancing its financial stability and positioning it to weather continued price weakness.
Optionality in Uranium and Rhodium Markets: Sibanye offers additional upside through its 59.2 million pounds of uranium resources and a significant position in rhodium (22% of global production). With South Africa producing 85% of the world’s rhodium, Sibanye can leverage this niche, high-demand market, particularly in an environment of constrained supply and stringent emissions regulations.
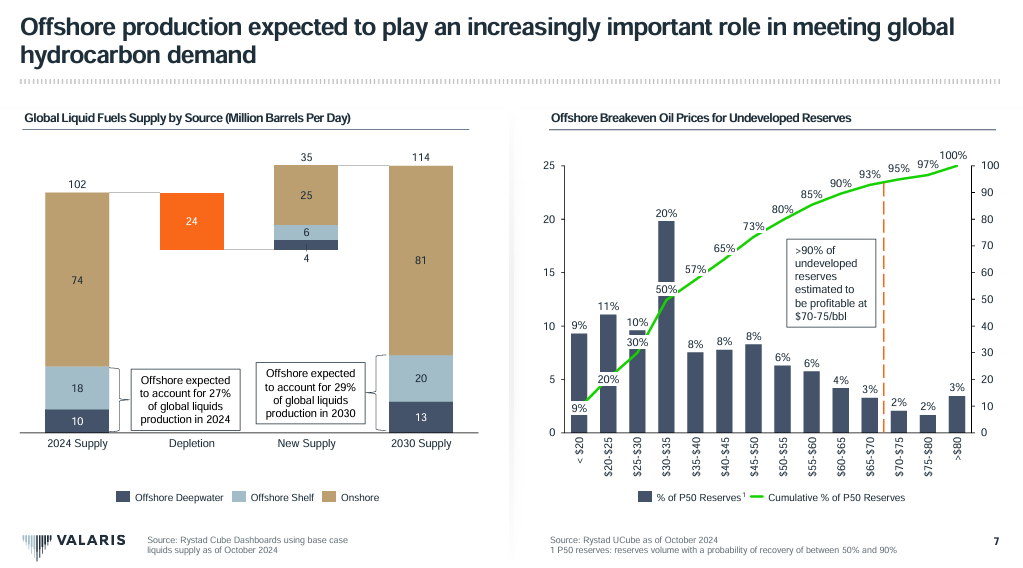
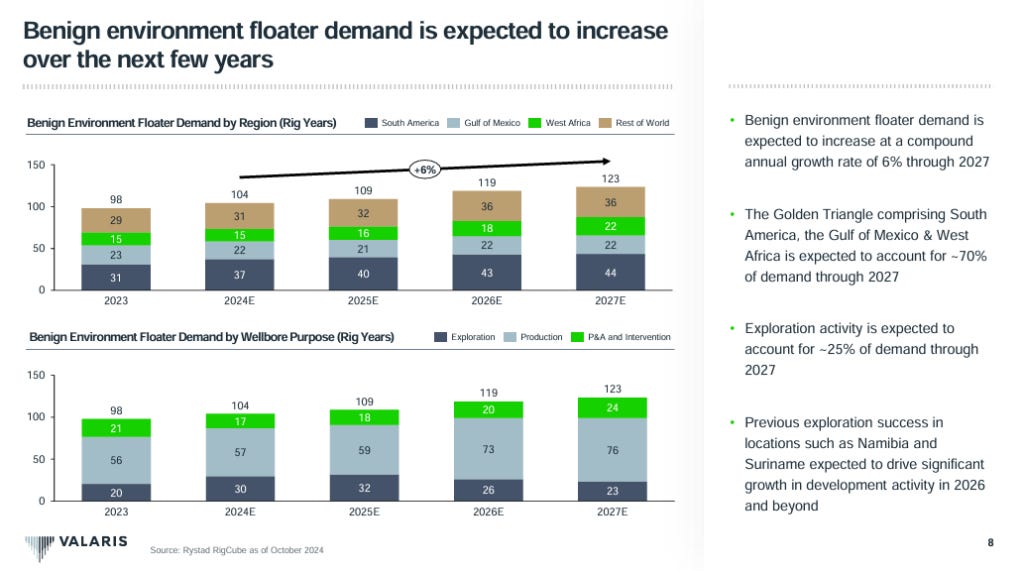
M&A beneficiaries with an energy angle. Along the line of deregulation, I expect Trump to put more M&A-friendly people in decision-making positions. As M&A activity picks up, we should see investment bankers work hard for their year-end bonuses. One sector which I find is at the crossroads of the energy push and M&A are Offshore Service Vessels (OSV’s). This really deserves a full length note but here are some quick thoughts:
Tight Supply and Limited Shipyard Capacity: Global shipyard capacity has fallen 60% since 2008, with current capacity levels similar to those seen in 2001. Most capacity is occupied with containerships and LNG carriers until late 2027, leaving dry bulk, tankers, and offshore vessels, including OSVs, competing for the limited remaining shipyard space. This capacity squeeze extends build times and raises costs for new OSVs, tightening supply and supporting higher charter rates.
Aging OSV Fleet and Low Newbuild Orders: The OSV fleet includes 4,160 vessels, of which 943 are currently laid up. Only a third of these are “premium” vessels (under 15 years old), with the remaining vessels aging rapidly. The OSV order book is below 5% of total fleet size, indicating limited new supply. With rising scrapping rates due to age restrictions, a constrained supply of newer, capable OSVs supports continued rate inflation in the sector, making existing assets more valuable.
Increasing Costs and Replacement Value of OSVs: The cost to build a new premium OSV has risen by 30-40% over the past three years, with newbuild costs for high-quality vessels estimated at around $60 million. Yet, companies like Tidewater and Seacor Marine are trading at 41% and 55% of newbuild parity, respectively, with Seacor’s fleet valued at around $11 million per vessel. This substantial discount to replacement value makes current OSV valuations attractive, offering upside potential as demand strengthens.
Higher Day Rates from Industry Consolidation: Recent mergers, such as Noble’s acquisition of Diamond Offshore, consolidate market power and create larger players with improved pricing leverage. For OSVs, consolidation could lead to a “seller’s market,” where fewer, larger operators can command higher day rates for their assets. The rumored merger between Transocean and Seadrill illustrates this trend, with combined scale potentially allowing greater control over fleet utilization and pricing, which would benefit OSV operators indirectly as support demand rises.
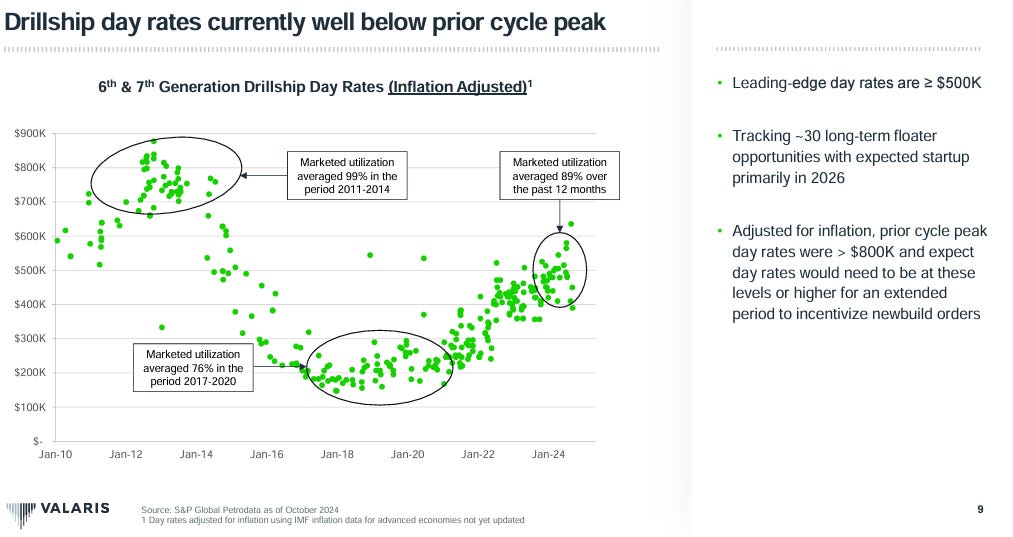
Lack of Appetite for Newbuilds Sustains Demand for Existing Assets: Due to uncertain contracting and high capital costs, there’s minimal interest in new offshore rig and OSV builds, with shipyards instead prioritizing higher-margin projects. This sustained lack of new supply supports higher rates, particularly as demand for offshore assets rebounds. 86% of marketed drillships are already in use, and demand for reactivating cold-stacked rigs is growing, with reactivation costs ranging from $75 million to $150 million per rig, further limiting supply.
Beneficial M&A for Balance Sheet Strength and Access to Contracts: M&A activity, such as a potential Seadrill-Transocean merger, would strengthen the balance sheet of leveraged companies, improving Debt/EBITDA ratios and access to cheaper financing. For Seadrill, merging with Transocean would provide access to a robust backlog of contracts, reducing “white space” (idle periods) and stabilizing revenue. This improved financial structure could attract more favorable lending terms and reduce refinancing costs, ultimately supporting profitability in a recovering market.
Discounted Asset Prices and Limited Downside Risk: OSVs are currently trading below replacement costs, with Tidewater’s fleet valued at around $25 million per OSV, or 41% of newbuild parity. Seacor Marine, while more leveraged, has an attractive asset base, with 55 OSVs valued at approximately $11 million per vessel. Investors have an opportunity to acquire assets at a significant discount with potential upside as day rates increase, while downside risks are mitigated by the low supply of new OSVs and the high cost of replacement.
I also see Valaris warrants as being particularly interesting
The Japanese Bank complex
Inflation and Rising Interest Rates Boost Profit Margins: Japan’s core inflation has been steadily rising, hitting 3.1% year-on-year as of mid-2024—one of the highest levels Japan has seen in over three decades. As inflation persists, the BOJ has started relaxing its yield curve control (YCC), allowing 10-year JGB yields to reach 0.65%. This shift enables Japanese banks to expand their net interest margins (NIMs), which had been squeezed for years under a near-zero-rate environment, directly enhancing profitability.
U.S. Protectionism Drives Domestic Investment in Japan: As the U.S. continues to push for supply chain diversification away from China, Japan has emerged as a preferred alternative, especially for industries tied to U.S. markets. Japan’s FDI inflows, although still relatively low at $250 billion in cumulative stock compared to China’s $4 trillion, are starting to rise as global companies seek stable, geopolitically secure production hubs. Japanese banks stand to benefit from increased loan demand as companies finance new projects domestically, tapping into Japan’s competitive wage and property costs, which are now on par with much of developed Asia.
Potential Investment Boom Driven by Pro-Investment Policies: Similar to the government-led tourism boom, Japan is well-positioned for a domestic investment surge if policymakers enact pro-investment reforms. In recent years, Japan’s tourism sector has turned a deficit into a surplus, with inbound tourism spending exceeding $33 billion annually. If similar policies target industrial investment, Japanese banks could see substantial growth in lending activity, as industrial production is still at 1984 levels, leaving significant room for expansion and modernization.
Yield Curve Control (YCC) Adjustments Favor Bank Profits: As the BOJ gradually relaxes its YCC policy, Japan’s yield curve is steepening, with the 10-year JGB yield hovering around 0.65% and forecasted to increase further. This steeper curve improves banks’ NIMs by widening the spread between short-term funding costs and long-term lending rates. While U.S. Treasuries signal potential recession with the 2-year yield dropping to 4.85% amid economic concerns, Japan’s JGB market reflects optimism, allowing Japanese banks to benefit from rising rates without severe economic contraction fears.
Pro-Labour Economic Environment Supports Bank Lending: Japanese wages have been gradually increasing, with recent reports showing 3.1% growth year-on-year, supported by pro-labour policies that aim to improve household purchasing power. This wage growth, combined with inflationary pressures, creates a favorable lending environment for banks, as households and businesses are more likely to seek credit in a rising-income landscape. In a reversal from the 1980s-2000s low-wage, pro-capital era, Japan’s tighter monetary policy is supportive of long-term loan demand.
Stable Economic Signals from Japanese Markets: Japan’s high-yield and JGB markets are showing resilience, contrasting with recessionary indicators in U.S. Treasuries. Japan’s JGB market has historically been a reliable indicator of economic stability, with Japanese 10-year yields now showing strength and domestic credit markets stable. This stability reflects Japan’s advantageous position in the current geopolitical environment, as global demand shifts away from China. For Japanese banks, these dynamics mean steady growth in capital inflows and a supportive environment for expanded lending opportunities.
XME / XLB / XLE Metals and Mining / Materials / Energy ETF’s
Moving back stateside, it seems wise to maintain exposure to the areas in the crosshairs of Trump’s labor revival. I suspect this sector will be a primary fiscal beneficiary over the next four years. One way to hedge inflation is to allocate to companies that will benefit from fiscal deficit spending. Moreover, I expect deregulation around these companies to take shape. The green transition agenda is rapidly losing steam, and no prominent world leader plans to attend the next COP meeting. This is unsurprising, given that rising geopolitical concerns and economic risks are taking the forefront of discourse. People will only care about the energy transition in times of calm and prosperity. I would likely be more picky than just allocating to these ETF’s broadly. On the energy segment, I particularly like names operating in liquid natural gas, considered a transitional energy source. Note I would stay away from utilities and focus on producers.
Russell come back?
Pro-Business, Domestic-Focused Policies: Trump’s economic policies favor deregulation, lower corporate taxes, and pro-manufacturing initiatives, particularly for U.S.-based companies. This could benefit smaller, domestic-focused firms in the Russell 2000, which have less international exposure than tech-heavy Nasdaq companies. By incentivizing U.S. production and reducing dependency on global supply chains, a Trump presidency might shift capital flows towards smaller-cap, domestically-oriented firms.
Rising Interest Rates and Inflation Concerns: Smaller-cap stocks in the Russell tend to be more sensitive to changes in U.S. fiscal policy and domestic economic trends. Should a Trump administration lean into policies that drive inflation or necessitate further rate hikes, it would make the case for high-multiple, growth-heavy Nasdaq stocks harder to justify, pushing investors toward value-driven, economically-sensitive sectors like those in the Russell.
Economic Nationalism and Infrastructure Spending: Trump’s past emphasis on infrastructure spending and economic nationalism may continue in a second term, spurring sectors like industrials, energy, and materials. Many of these sectors are more prominent in the Russell 2000 than the Nasdaq, which is tech-heavy. A focus on domestic investment could make smaller-cap industrial and service firms more attractive to investors.
Historical Parallel: Early 2000s Rotation: A significant rotation from the Nasdaq to the Russell last occurred after the dot-com bubble burst. From March 2000 to early 2003, the Nasdaq declined by nearly 80% from its peak, while the Russell 2000 fell by only 45%. As investors fled overvalued tech stocks for smaller, undervalued companies, the Russell 2000 gained traction, and from 2003 to 2006, it outperformed the Nasdaq with a cumulative return of 70%, compared to the Nasdaq’s 50%. Stimulus-driven, pro-growth policies helped smaller-cap stocks recover faster and outshine tech-heavy indices, a trend that could repeat under a second Trump administration if fiscal and regulatory policies favor the domestic economy.
I expect to layer in 25 delta LEAP call options for about 2% of NAV on this trade.
European Military Industrial Complex
With the shift towards a more isolationist U.S. foreign policy, Europe has started investing heavily in defense autonomy, improving the bottom line of European defense contractors. (coming up in the next thematic equities primer)
That is probably enough trade idea’s to chew on for now.
Cheers!





I am Perplexed by strong thinking by some, that you are strongly convinced, that he will be very pro-labour....
Why do you believe, that "the living symbol" of a "rough American capitalism" originating from a capitalist family, would go pro-labour?
To be clear, I do not judge what is right or correct, I just observe and judge based on past action and ones "social sircle" not on some (pre-election) promises... Before and durong the first mandate, there had been a lot promises, but besides tax-cuts not much has been implemented, "not even the wall", which for me shows a strong pro-capital bias....
What do you think?