

The Tech Equities Odyssey: Prometheus and the Chains of Duration
Bound by the chains of duration, growth stocks watch as rising yields steal their promised fire of future returns.

Given the recent increase in readers, I would also like anyone reading this publication to take some time to review the Disclaimer, carefully crafted by my personal legal team at claude.ai… Now, onto less serious topics…
Empirically, the greatest returns have come from investing in compounding human innovation. As a thematic investor, much of my time is spent understanding new technologies—their mechanics, applications, and funding. Exploring these innovations is central to my process, and I often immerse myself in tools and frameworks to glimpse the near future. Recently, I’ve been captivated by AI agents, particularly the GitHub project elizaOS. However, investing in innovation is far from straightforward, especially for active investors seeking consistent returns across varying market conditions. The challenge lies in balancing long-term vision with near-term macroeconomic realities. I stay focused until a significant macroeconomic shift appears imminent, which is why this publication emphasizes macroeconomic analysis. With such a shift potentially underway, we’ll explore a key question: where will equity valuation multiples go next?
Let’s Not Talk About Revenues…Yet…
Valuations have become increasingly reliant on optimism about AI adoption and industrial policy driving revenue growth, yet they appear unaware of the significant costs associated with training and operating these AI models. The bullish case assumes AI will surge within the next 12 months, driving productivity gains, or that deregulation and policy initiatives will deliver immediate growth. But this optimism discounts the friction inherent in these transitions. AI, while undoubtedly transformative, demands substantial computational resources and energy to train and infer, making scalability an expensive and complex endeavor. Similarly, industrial policy’s potential impact is not a quick fix; geopolitical tensions and demographic shifts present considerable hurdles.

This topic is extremely interesting and well worth a standalone article, which can also lead us to understand the next AI trade once multiples get a chance to contract (I hope…because I am extremely excited for the industrial revolution that is ahead of us)
Pandora’s Bonds: Unpacking the Risks of Rising Yields
Our economic framework allowed us to determine early on that tail end yields would rise despite the Fed embarking on a growth-scare fueled cutting cycle kicking things off with a Big-Mac rate cut.

This prompted our research on the constituents of inflation where we formed a view of heightened inflation volatility with a rising structural floor but steering clear of inflation spike alarmism.


Most recently we have studied the likely impact of a treasury issuance shift from bills to bonds which further supported our rising long-end yields thesis.

In that article we initiated the topic of the impact from this yield curve steepening on equities and recommended to keep hedges close to our chest. One such hedge was our pre-NFP trade designed to smooth over negative reaction of equities to continued inflation.

For now, enough ink has been spilled discussing the why behind rising yields let’s focus on one core consequence regarding what everyone cares about; risk asset valuations and ask:
Wait… What Do You Mean My Future-Proof Growth Stock Is Some Antique Bond?
Some stocks are best thought of as zero-coupon bonds with an uncertain payoff far in the future—especially those where most of the value is tied to cash flows expected years down the line. Think of a tech startup pouring money into growth today, banking on profits much later. The further out those cash flows are, the more sensitive the stock’s value is to changes in interest rates. In finance-speak, these are "long-duration" stocks, a term borrowed from bond analysis.
Why does this matter? Because rising interest rates don’t just make borrowing more expensive; they also shrink the present value of distant payoffs. Growth stocks, with most of their value weighted toward the future, feel this impact acutely. A higher discount rate means the future is worth less today, plain and simple.
Contrast that with traditional high-capex businesses, like utilities or industrial manufacturers. These companies generate steady cash flows year after year, with less of their value tied up in distant, speculative growth. They’re more like coupon-paying bonds—consistent, reliable, and less influenced by rate changes. Their "shorter duration" means they’re less sensitive to fluctuations in interest rates, making them feel a bit more grounded when rates rise.
The Intuition for Big Tech
When we look at big-tech companies like Microsoft, the bond analogy becomes more nuanced. Microsoft generates substantial recurring cash flows from its core businesses, such as software and cloud services, making this part of its profile resemble a short-duration bond—steady and less sensitive to rising rates. However, Microsoft is also investing heavily in AI infrastructure and large language models, positioning itself for speculative, long-term growth. This part of its valuation behaves like a long-duration bond, highly vulnerable to higher discount rates.

This hybrid profile—part cash cow, part long-term growth bet—creates a unique dynamic. Rising yields may compress the valuation of Microsoft's future-oriented AI investments, while its core businesses provide stability, tempering the overall impact. In this framework, big tech occupies a middle ground between traditional growth stocks and high-capex industrial firms, balancing near-term cash flow resilience with exposure to rate-sensitive, long-term growth opportunities.
Deriving the Intuition:
Skip to the next section for charts and data.
This bond-like framing provides a foundation to rigorously analyze how rising yields affect equity valuation multiples, particularly for companies with mixed-duration cash flow profiles. At its core, this is a problem of discounted cash flow (DCF) sensitivity to changes in the discount rate, which we can quantify using tools borrowed from bond math.
Let’s express the fair value of an equity today:
Where:

The required rate of return is composed of the risk-free rate expressed by the return an investor could earn on a risk-free asset (Treasury Bills, Notes and Bonds); and the additional return demanded by investors for bearing equity risk which we call equity risk premium (ERP)
hence:
When either the risk free rate or the ERP rises, the required rate of return increases, raising the discount rate and reducing the present value of future cash flows. This effect is particularly acute for growth stocks, where valuations rely heavily on distant, speculative cash flows. Conversely, lower risk free rates or risk premiums reduces the required rate of return, enhancing cash flow valuations and boosting stock prices—especially for long-duration assets like growth stocks.
Ok… But How Do I Link This To Multiples?
Equity valuations in practice are often discussed in terms of valuation multiples, such as the Price-to-Earnings (P/E) ratio or EV/EBITDA. While these are typically derived from near-term earnings or cash flows, their sensitivity to macroeconomic variables—particularly interest rates and the ERP—is often overlooked. Let’s bridge this gap by expressing these multiples explicitly in terms of macroeconomic factors. Let’s start with the king of equity valuation multiples:
The Price to Earnings ratio
The P/E ratio is a cornerstone of equity valuation, defined as:
For the simple case of a dividend paying company
with:

Assuming a steady-state growth model where dividends grow at a constant rate g, this simplifies to:
with E being earnings and b the retention ratio. We can then directly express the P/E ratio given our simplifying assumptions as:
for a Big-Tech type company; we can extend this to (again with simplifications):
with b here having the interpretation of being money from free cash flow being re-invested into the business and g = b x ROE with ROE being the return on equity.
An other useful multiple is the EV/EBITDA
In a steady-state scenario, a company grows its EBITDA at a constant rate g indefinitely. The Enterprise Value (EV) in this case is the present value of all future EBITDA flows, discounted at the company’s Weighted Average Cost of Capital for both equity and debt blended (WACC).
For constant growth, where EBITDA grows at a rate g this infinite series simplifies to:
We then express our desired ratio as:
The WACC reflects the company’s blended cost of funding its operations, incorporating both equity and debt:
where:

yielding our final form:
I think what we have just put together is pretty cool; we essentially conjured (with the help of some very liberal assumptions) a framework to think about equity valuation multiples relative to macro-economic variables. I would not toss these formulas into some code to systematically trade my money; but rather to develop intuition when looking at readily available data.
Now let’s go into the final piece of this puzzle which is understanding the ERP.
Equity Risk Premium (ERP): A Decomposition
The Equity Risk Premium (ERP) represents the additional return investors demand for holding equities over a risk-free asset, compensating for the inherent risks of equity investments. We can therefore define it as:
where:
For a specific firm, the ERP can be broken into:
Systematic Risk: Exposure to market-wide factors that cannot be diversified away.
Idiosyncratic Risk: Firm-specific risks that are unique to the company.
\(ERP = ERP_{\text{systematic}} + ERP_{\text{idiosyncratic}}\)
Systematic Risk Component
The systematic risk component reflects the firm’s exposure to broad market movements and macroeconomic factors. This is commonly expressed using the Capital Asset Pricing Model (CAPM):
where:

While CAPM is widely used, alternative models provide more nuanced representations of systematic risk. With Arbitrage Pricing Theory (APT) we can generalize CAPM by allowing for multiple risk factors:
where:

Fama-French Multi-Factor for example is an example of this extension.
Idiosyncratic Risk Component
The idiosyncratic risk component captures firm-specific risks that are uncorrelated with the broader market. The contribution of these risks to ERP is given by:
where:

However, we will focus on understanding systematic risk. Idiosyncratic risks are best left to financial statements and proper private-equity-style analysis.
Looking at the Data:
I’ll try to keep this less verbose than I usually do (something to work on; I’ll likely be re-joining the corporate world in a couple of months and need to optimize my information-per-ink ratio)
In the broader context of valuation multiples; where do we sit historically right now? To put it simply; it does not get much more expensive than this.


But as we’ve explored through our fixed-income analogy, the most insightful way to understand equity valuations is by dissecting these ratios into their fundamental components. Rather than viewing metrics like P/E or P/S in isolation, we can examine how macroeconomic factors—such as interest rates, the equity risk premium, and growth expectations—interact to shape these valuations. This approach allows us to see beyond surface-level trends and understand the structural forces driving current multiples, especially in an environment where valuations are pushing historical extremes. Let’s break these ratios down into their key elements to uncover what’s really under the hood.
One well known measure for the ERP is the Shiller Excess CAPE Yield which has broadly the same interpretability as what we have derived. We can understand it as the excess return over risk free yields we can expect from equities.

Seems like it is almost time to buy government bonds; shame that despite the PPI and CPI coming in cooler we are still not constructive on treasuries (I’ll possibly soften my stance next print). To intuit the relation of the index with the risk free rate, I added the TLT long duration bond ETF to the chart; the joint pattern is striking.
Now we did not spend time fabricating some math to not make an attempt at calculating the ERP our selves. So here we go:

This chart gives us an important context, that the technology index has seen its risk premium erode faster than the broader SP500 in the last few months. Without needing to dig too far, the explanatory factor behind this is that the Nasdaq ascending valuation is it’s significantly higher growth prospects than the broader S&P. And artificial intelligence here is to blame. Now; I am all on board with lofty projections of innovation and an economic revolution driven by artificial intelligence. I could also believe that new technologies can reduce the lower bound on structural inflation counter-acting fiscally driven inflation. However as we have derived previously; prospects of future growth elongate the duration of the equities and increase their sensitivity to rates (not to mention.. AI is not cheap…).
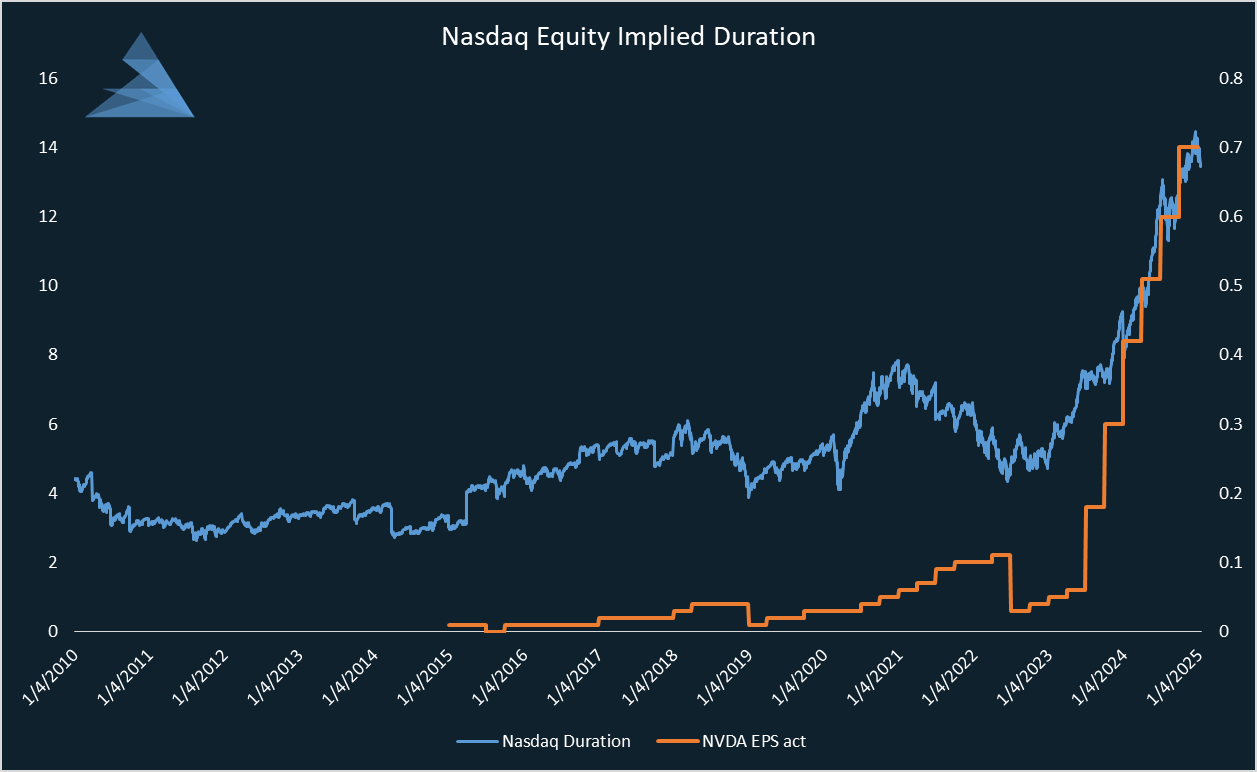
And look at that; using our little math squiggles in the prior section we can get this this chart which really tells quite the story. I used NVDA EPS as a proxy for hyperscalar capex spend (I know that’s not right; my gaming laptop with some RTX something or other chipped in) but as the big-tech names piled into capex - they effectively front-loaded negative cashflows and created substantial anticipation for future revenues. Will it be worth it? I think that yes; but that’s why I like to hedge with ZB futures instead out outright Q’s. Even though the CPI made a dent in my ZB short track record; I maintain rolling forward my ZB shorts to try isolating the valuation multiple component of the price; I would not dare bet against AI powered growth it self.
Some Things to Think About…
Given the increased duration of big tech coupled with rising yields and despite that, rising prices and expanding multiples, we need to offer some explanations for this:
Earnings Growth Expectations: The Rocket Fuel of Belief
Investors are betting the farm (or at least their portfolios) on the belief that AI is the next Industrial Revolution. The market narrative is that future earnings growth will accelerate so rapidly that it not only justifies, but demands, a re-rating of valuations. Investors aren’t pricing today’s tech companies based on what they earn—they’re pricing them on the potential of an AI-augmented tomorrow. It’s as if the Nasdaq collectively told the bond market, “Sure, rates are rising, but have you seen our growth curves? They laugh at your puny yields.”
Equity Risk Premium Compression: Confidence Wears Prada
Risk is in the eye of the beholder, and right now, investors are squinting through rose-tinted glasses. When optimism takes over, the equity risk premium (ERP) compresses because, frankly, investors don’t feel the need to demand extra compensation for holding stocks. AI-fueled dreams of transformative growth make stocks feel like a safer bet than they are. In this environment, a compressed ERP acts like an anesthetic, numbing the pain of higher discount rates.
Liquidity: The Silent Enabler
Rising yields are supposed to drain liquidity, but pockets of the market still slosh with cash. Retail inflows remain resilient, and corporate buybacks provide a steady bid under stock prices. We also have sovereign wealth funds and institutional players, flush with cash, are snapping up tech stocks like limited-edition sneakers (with career risk in mind). And let’s not forget foreign investors wanting a bit of American exceptionalism for them selves in order to forget anemic growth or balance-sheet recessions at home! This liquidity creates a cushion, making it easier for valuations to stay aloft even as the yield tide rises.
Coming up: The Tech Equities Odyssey: Riding the Sirens’ Liquidity Song
Like Narcissus staring into the reflection of their own valuations, they forget the pond dries up without liquidity.

The Narrative Monopoly: FOMO on Steroids
AI isn’t just a growth story; it’s the only growth story right now. This scarcity of investable narratives drives what I call the “narrative monopoly.” Investors are pouring capital into tech not because they love the valuation math, but because there’s nowhere else to go. The fear of missing out (FOMO) amplifies this dynamic, turning every dip into a buying opportunity. It’s like a reverse short squeeze—only in this case, everyone’s squeezing to stay long.
Technical view on Mag 7
According to the fundamental, self-evident, and natural laws of technical analysis—which rival election pollsters in their predictive prowess—a notable 'Ascending Schrödinger Mirage' pattern appears to be forming on the monthly chart of American technology companies. While this technical formation may not yet have made its way into the CFA curriculum, it strongly suggests that valuations are teetering on the edge of a trendline supported by hope, American exceptionalism, and the lingering traces of abundant liquidity still sloshing through the system.

Thank you for making it this far! Please drop a <3 and share with those who you think would find this note interesting; or else i’ll be </3. For the bourgeois subscribers, I’ll be sharing the specific list of equities I’ve allocated to in the space theme, along with some quick insights on the space industry. Upgrading your subscription not only gives you access to additional valuable research and analysis but also helps support this independent effort—funding data purchases, specialized reports, and the development of tools (like the Schrödinger Mirage indicator) to continue delivering high-quality insights.
My goal is to have a reasonably robust open-source analysis package for macro data and company valuation by 2026 and to drill down into explanations here.
Wrapping Up With Our Space Theme
Now that we have illustrated our thought process for how to approach equities in the coming months, it is worth quickly making some finishing thoughts on our flagship (because it is the only one at this point) thematic equity note, of which we exited 3/4 of the position booking 50% returns since early November.


Keep reading with a 7-day free trial
Subscribe to Tetractys Research to keep reading this post and get 7 days of free access to the full post archives.